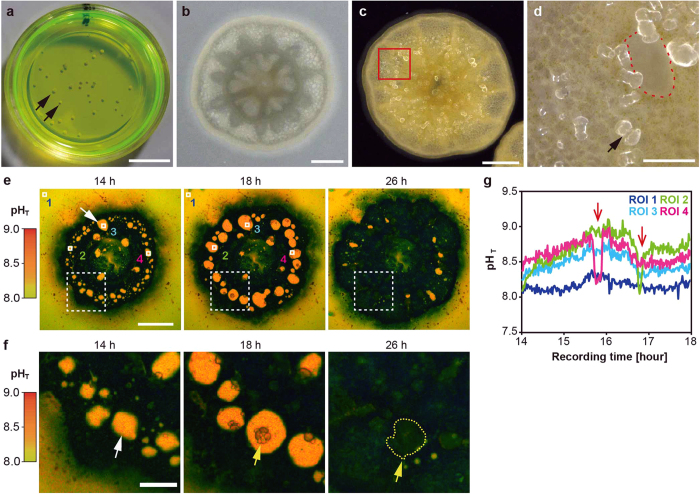
Figure 1. Continuous pH imaging of a primary polyp in HPTS.
(a) Coral primary polyps in a glass-based dish under HPTS incubation (green colored solution). Black arrows show individual polyps. (b) A whole image of a coral primary polyp from the top. (c) An image of a coral primary polyp under a dark microscopy field from the bottom. The area enclosed by the red square corresponds to that shown in (d). (d) A high-magnification image of the enclosed area from (c). The black arrow indicates a crystal. The aperture area enclosed by a red dotted line shows presumable subcalicoblastic medium (SCM). (e) The numbers in the upper parts of the panels indicate recording times. Time series of pseudocolor images indicate the distribution of pH values (total pH scale in left parts) in developmental process of the primary polyp at the bottom (14–26 h). The white arrow indicates the SCM (orange) and black regions correspond to coral tissues. ROIs 1–4 were examined for intensity changes. Scale bar: 200 μm. Also see Supporting Movie 1. (f) A high-magnification image of the white-dashed line square in (e). The white arrow indicates the SCM, and yellow arrows and dashed lines the developing crystals (14–26 h). Scale bar, 100 μm. (g) pHSCM changes in ROIs 1–4 over time (14–18 h). Red arrows show the sudden decrease of the pHSCM.

