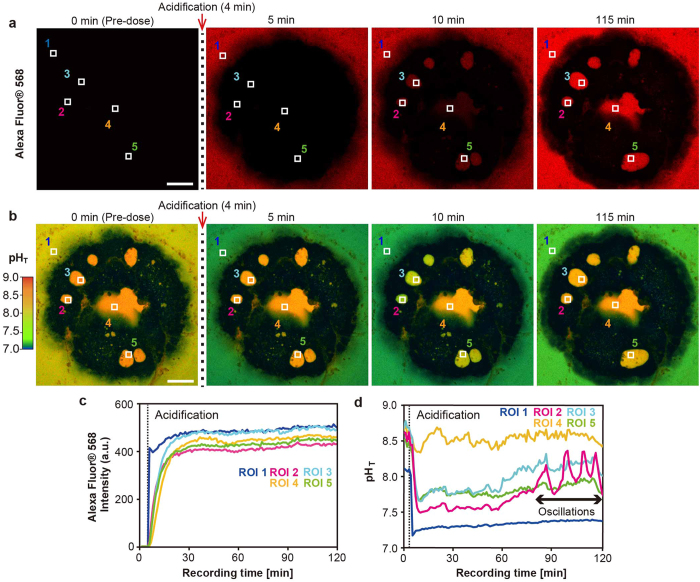
Figure 2. Dynamic pHSCM upregulation induced by acidified seawater observed by pH imaging.
(a) Acidified seawater was added 4 min after the start of the experiment. Numbers in upper parts of panels indicate recording times. The distribution of Alexa Fluor® 568-labeled acidified seawater was visualized as a red color soon after addition of acidified seawater (containing Alexa Fluor® 568 and HPTS). ROIs 1–5 were examined for intensity changes in (c). Scale bar: 100 μm. Also, see Supporting Movie 2. (b) Time series of images showing continuous pH imaging after adding acidified seawater. ROIs 1–5 were set for pH changes in d. Scale bar, 100 μm. Also, see Supporting Movie 3. (c) Fluorescence intensity changes in five ROIs in arbitrary units over time. The time point of addition of acidified seawater is indicated by a black dashed line in panels in (c,d). (d) pHSCM changes in acidified seawater conditions. pH oscillations were detected 90 min after addition of acidified seawater.

