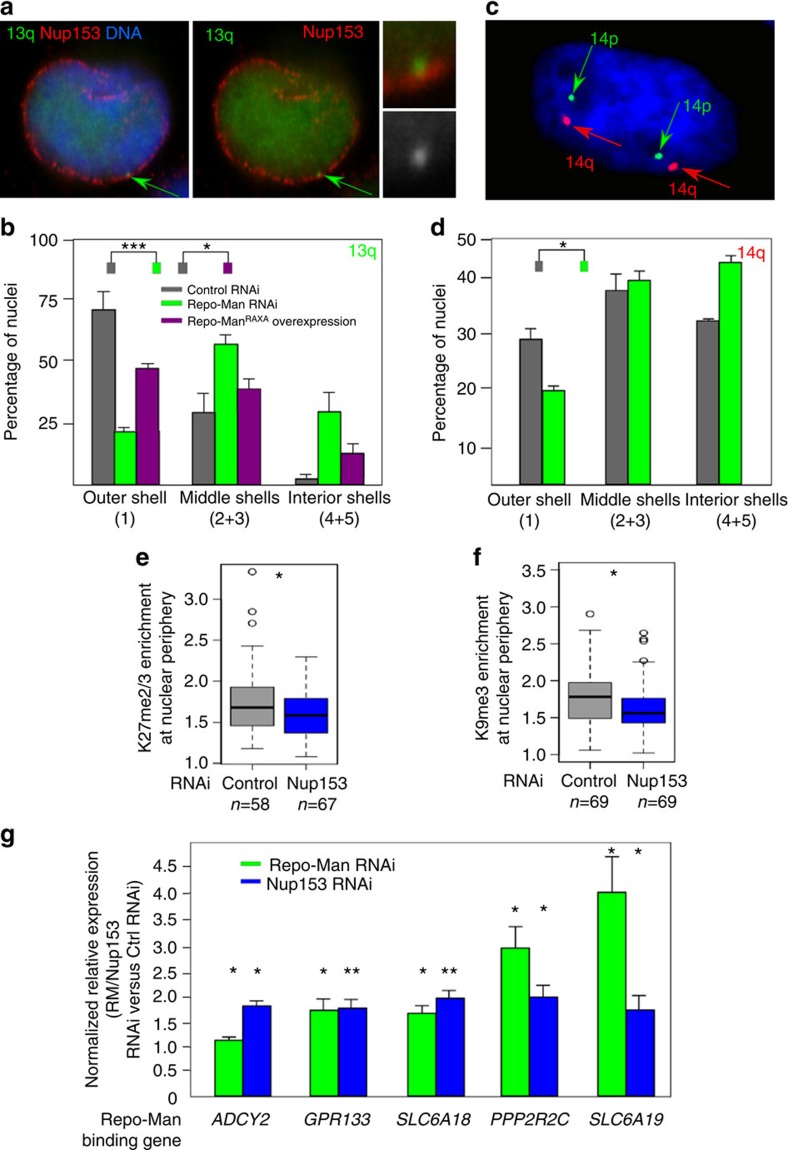
Figure 6. Repo-Man depletion affects chromosome positioning.
(a) HT1080 cells containing a LacO array inserted at 13q22 and expressing GFP:LacI were fixed and stained for Nup153. The arrow indicates the integration site. (b) Position of the chr13q22 was measured using an erosion script software69 across five concentric shells (1—most outer shell to 5—most inner shell) after RNAi with control or Repo-Man oligos or transiently transfected with the dominant-negative Repo-ManRAXA mutant. (c) 3D FISH with probe CTC-820M16 (red signal) mapping to the subtelomeric region of chromosome 14 performed on HeLa cells. (d) Quantification of spots location described in c, using the erosion script software. (Fisher test, *P<0.05, **P<0.01, ***P<0.001 using two-three replicates). (e) Enrichment of H3K27me2/3 at the nuclear periphery after Nup153 RNAi. (f) Enrichment of H3K9me3 at the nuclear periphery after Nup153 RNAi. Enrichment was calculated as in Fig. 2e. Mann–Whitney test (*P<0.05), n is depicted in the figure. In box plots in e and f, central line represents the median, box limits are the 25th and 75th percentiles and whiskers extend to 1.5 x interquartile range. (g) Differential expression of telomeric genes bound by Repo-Man between control and Repo-Man (green) or Nup153 (blue) RNAi. Delta–delta-CT method was used and normalized for GAPDH. Error bars=s.e.m. between three replicates. t-test was used for statistical analysis (*P<0.05, **P<0.01).

