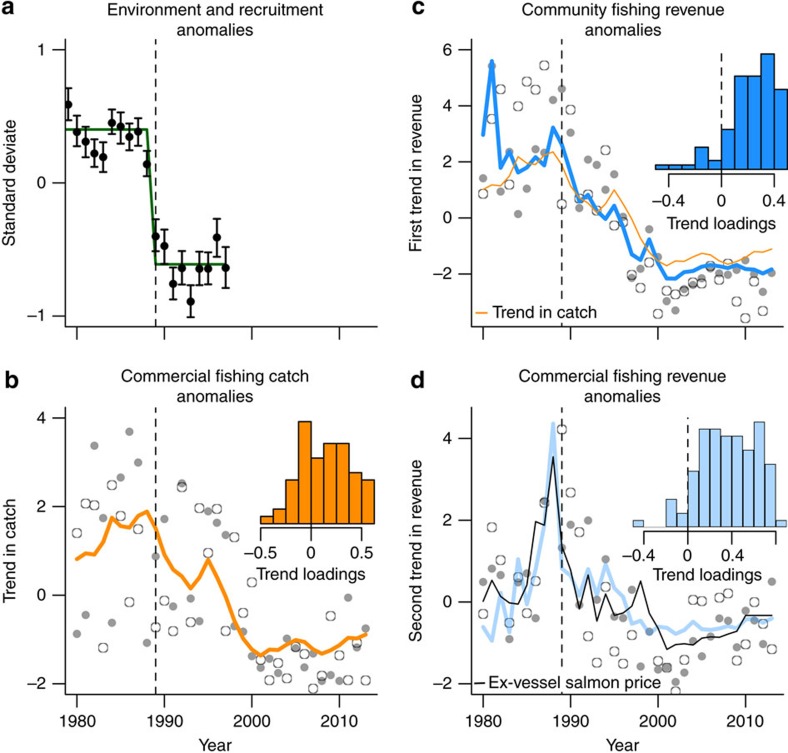
Figure 1. Ocean regime changes and market shifts impact fisheries catch and revenue.
(a) Regime shift analysis of 100 physical, chemical and biological time series from across the North Pacific region (redrawn from Hare and Mantua 2000). The green line represents the average deviate from before and after 1989; (b) The most commonly shared trend in commercial harvest by stock (species location combinations) (orange line) as determined by dynamic factor analysis (DFA). The analysis included time series of commercial harvest from 60 stocks delineated by fishery group (for example, crab, salmon) and location harvested (for example, Prince William Sound, Southeast). Open and closed circles in grey are example fits for two stocks. Inset histogram of factor loadings of individual stocks on the shared trend in commercial catches. Loadings indicate the strength of association between the commercial catch of a stock and the estimated trend. A negative loading indicates that the commercial catch of a stock trends in the opposite direction. (c) The first of two commonly shared trends in commercial fishing revenue across communities in Alaska as determined from a DFA (blue line). The analysis included time series of commercial fishing revenue from 105 communities from across Alaska. The orange line is the common trend in commercial fisheries catches by stock (b). Open and closed circles in grey are example fits for two communities that loaded strongly on the first trend. Inset histogram of factor loadings of individual fishing communities on the first shared trend in commercial fishing revenue. (d) The second of two commonly shared trends in commercial fishing revenue (blue line). Open and closed circles in grey are example fits for two communities that loaded strongly on the second trend. The black line indicates the real ex-vessel price per pound for salmon paid to fishers in Alaska. Price is z-score standardized for display on the same axes. All price and revenue data were adjusted for inflation using the consumer price index (2013 US$). Inset histogram of factor loadings of individual fishing communities on the second shared trend. The vertical dashed line in all panels marks 1989 and indicates the timing of the regime shifts.

