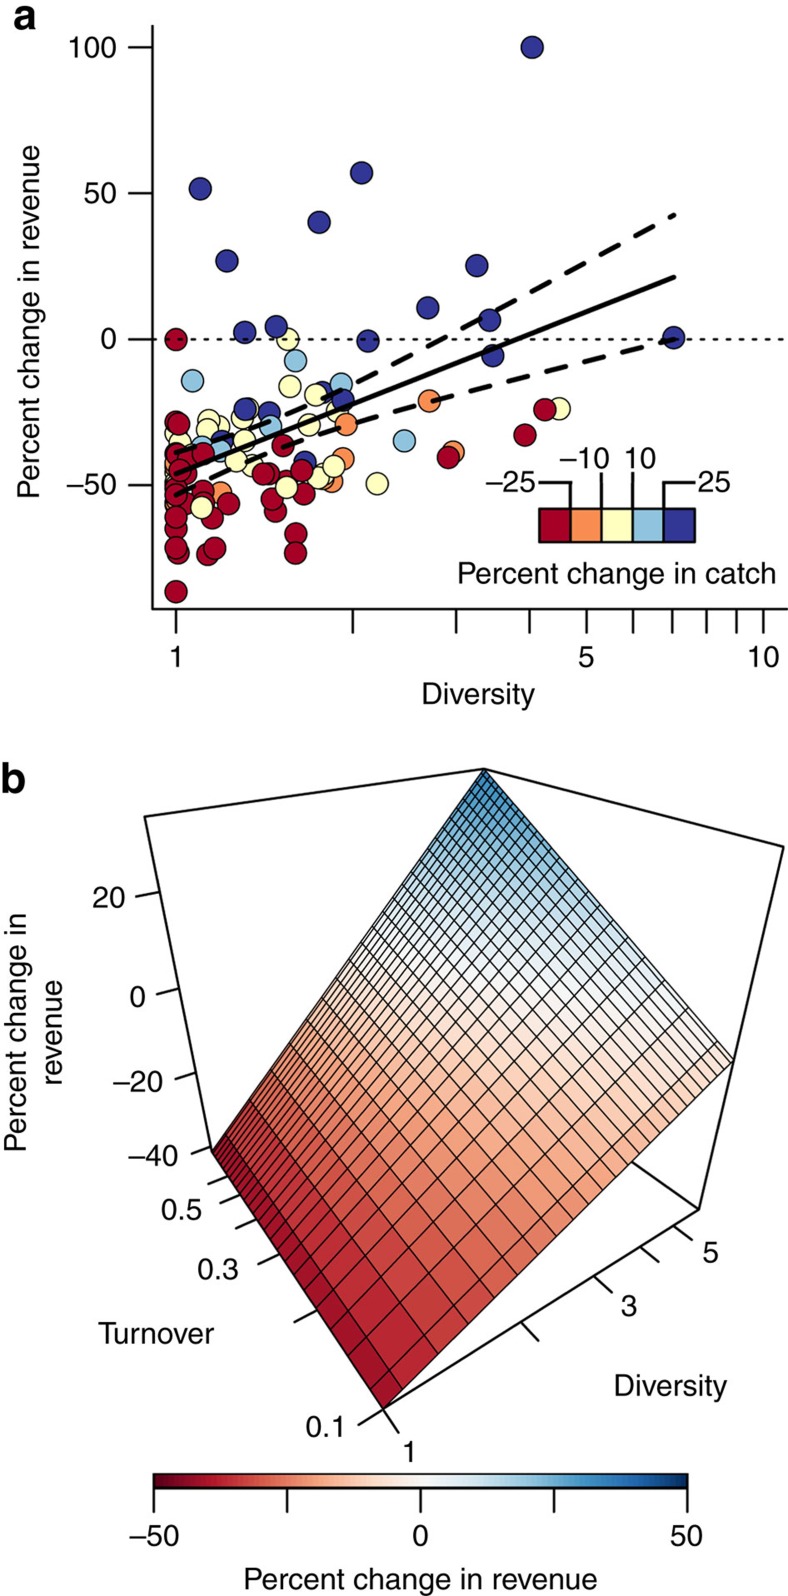
Figure 3. Diversification and turnover of fishing opportunities buffer against abrupt shifts.
(a) Observed changes in revenue from before (1980–1989) and after (1990–1999) the regime shifts are plotted against diversity of fishing opportunities for 105 Alaskan fishing communities. Diversity, plotted on a log-scale, was measured as the reciprocal Simpson's index so increasing values are increases in diversity. Diversity indicates both the total number of opportunities and the distribution among component stocks. Diversity is computed for each community over the 10 years before 1989. Total annual revenue from fishing (2013 US dollars) were used to weight years in the computation of the diversity index. The line of best fit with 95% confidence intervals is plotted in black (R2=0.21, P<0.001, linear regression). Per cent change in commercial fishing catch is represented by the colour gradient, with cool colours representing a positive per cent change and warm colours a negative per cent change. (b) Wireframe of the per cent change in revenue against diversity and turnover. Turnover (often referred to as beta diversity) is Jaccard's dissimilarity index measuring changes in the in the relative contribution of stocks to a communities overall portfolio (by catch). Turnover is plotted on a log scale but values range from zero turnover to 0.4 or 40% turnover, with increasing turnover towards the back of the plot. The wireframe is generated from predictions of a linear model between diversity and turnover including a significant interaction (R2=0.26, P<0.0001, linear regression, Supplementary Tables 5 and 6). Ranges used to generate the surface are well within the bounds of the data as to produce conservative changes in revenue within the bounds of the observed data (Supplementary Fig. 1).

