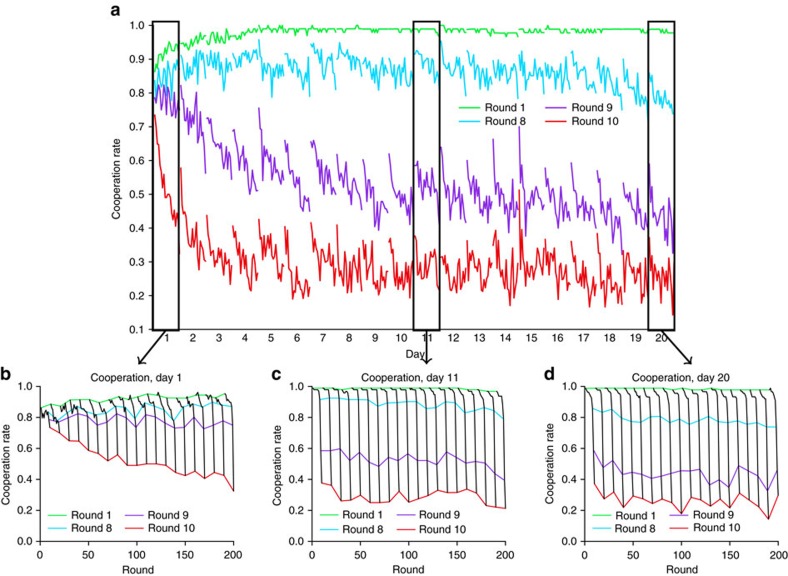
Figure 1. Cooperation over time.
(a) Average cooperation rate for rounds 1 (green), 8 (blue), 9 (purple) and 10 (red) as a function of time over the 400 games of the experiment. The experiment ran for 20 consecutive weekdays, each of which comprised 20 games of 10 rounds each. Cooperation in rounds 9 and 10 clearly diminishes for several days, consistent with unravelling dynamics observed in prior work, but then appears to stabilize. (b–d) Cooperation as function of round (black lines) on days 1 (b), 11 (c) and 20 (d). Each day comprised 20 consecutive games of 10 rounds each, yielding 200 rounds in total. In all cases, coloured lines correspond to cooperation levels for rounds 1 (green), 8 (blue), 9 (purple) and 10 (red). The same pattern of unravelling in early days followed by stabilization is apparent.

