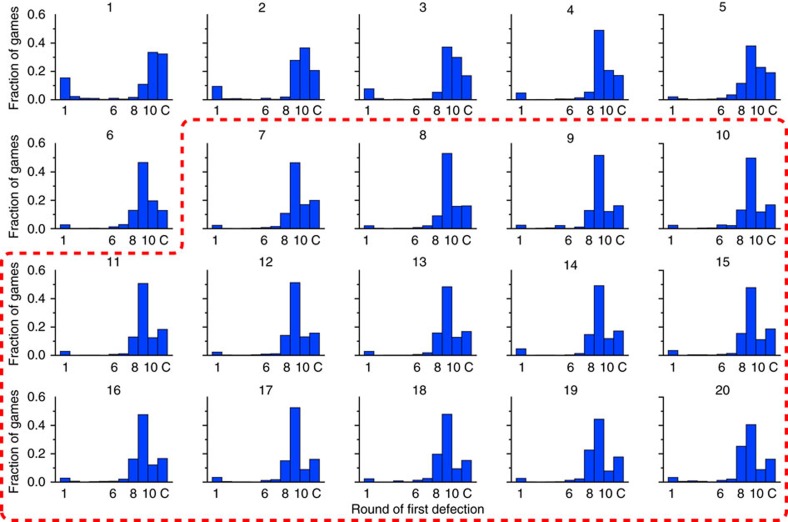
Figure 3. Stabilization of defection.
Distribution of round of first defection, rd, over all games by day. The last bin, C, indicates games where neither player defected. In days 1–6, players appear to converge on one of a number of threshold strategies, in which they cooperate conditionally until some predetermined ‘threshold' round ri and then defect unilaterally. During this interval the modal round of first defection also creeps earlier. The red highlighted region denotes the ‘stable' phase of the experiment during which the distribution of round of first defection remains sufficiently similar from day to day that a K–S test is non-significant.

