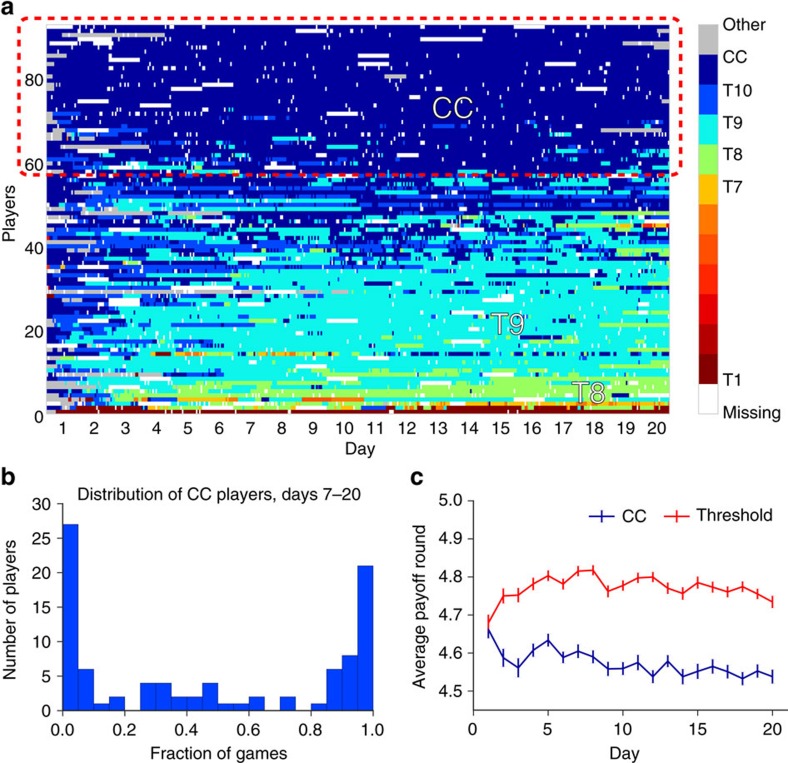
Figure 4. Identification of resilient cooperators.
(a) Inferred strategies over time. Each cell represents the strategy for a single player (row) for a single game (column), and is coloured by cooperativeness (more blue ⇒ more cooperative; more red ⇒ less cooperative). T1–T10 refer to ‘threshold' strategies, where a player playing strategy Tx conditionally cooperates up to round x−1 and then defects unilaterally from round x. T1 corresponds to defection on every round and CC corresponds to full conditional cooperation (also known as ‘grim trigger'). Grey regions refer to play that was not consistent with any of the assumed strategies. White regions refer to missing games. (b) Histogram of % of games classified as CC. The right-hand mode comprises 36 players who play CC in at least 80% of games; these players are identified as resilient cooperators. (c) Average per-round payoffs of players identified as resilient cooperators (blue line) and rational players (red line) respectively (averages are computed over games for each day; error bars are s.e.).

