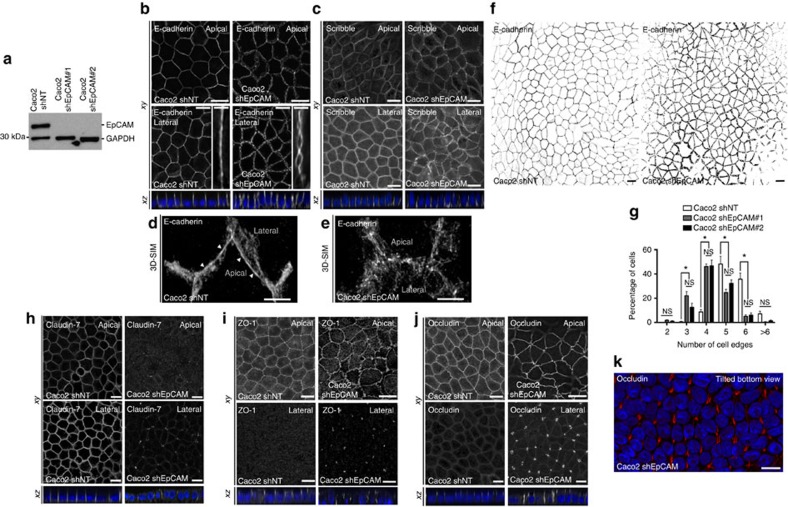
Figure 2. EpCAM silencing leads to unusual tight junction positioning defects at tricellular junctions.
(a) Western blot analysis of the EpCAM expression level in control (Caco2 shNT) or EpCAM-deprived (Caco2 shEpCAM #1 and Caco2 shEpCAM #2) clones. GAPDH was used as loading control. (b,c) Confocal microscopy analysis of E-cadherin (b) and Scribble (c) on the apical or lateral sides in control and EpCAM-depleted cells. Scale bars, 5 μm. Nuclei were detected with Hoechst 33342 staining (blue). (d,e) 3D-SIM microscopy analysis of E-cadherin localization in control (d) and EpCAM-deprived (e) cells. Scale bars, 2 μm. (f) Cell shape analysis after E-cadherin immunostaining in control or EpCAM-deprived cells. Scale bars, 5 μm. (g), Statistical analysis of polygonal shape in control or EpCAM-deprived cells. Three independent experiments were carried out. N (Caco2shNT)=517 cells, N (Caco2shEpCAM#1)=550 cells, N (Caco2shEpCAM#2)=427 cells. Caco2 shNT cells with two cell edges=0%, three cell edges=0.455±0.787%, four cell edges=8.673±3.406%, five cell edges =48.154±11.123%, six cell edges=35.652±8.888%, more than six cell edges=7.067±3.851 cells%. Caco2 shEpCAM#1 cells with two cell edges=1.822±0.733 cells%, three cell edges=22.031±5.906%, four cell edges=46.061±3.851%, five cell edges=24.728±4.344%, six cell edges=5.027±2.210%, more than six cell edges=0.330±0.572%. Caco2 shEpCAM#2 cells with two cell edges=0.966±0.848%, three cell edges=12.542±5.942%, four cell edges=46.739±8.082%, five cell edges=32.319±4.777%, six cell edges=6.098±3.412%, more than six cell edges=1.336±1.261%. Unpaired t-tests, *P<0,0001. Values are mean±s.e.m. (h–j) Confocal microscopy analysis of claudin-7, ZO-1 and occludin on the apical or lateral sides in control and EpCAM-depleted cells. (k) Confocal analysis of occludin (red) location at TCs in EpCAM-deprived cells, 3D rendering of z-stacks. Tilted bottom view is presented. Scale bars, 5 μm. Nuclei were detected with Hoechst 33342 staining (blue).

