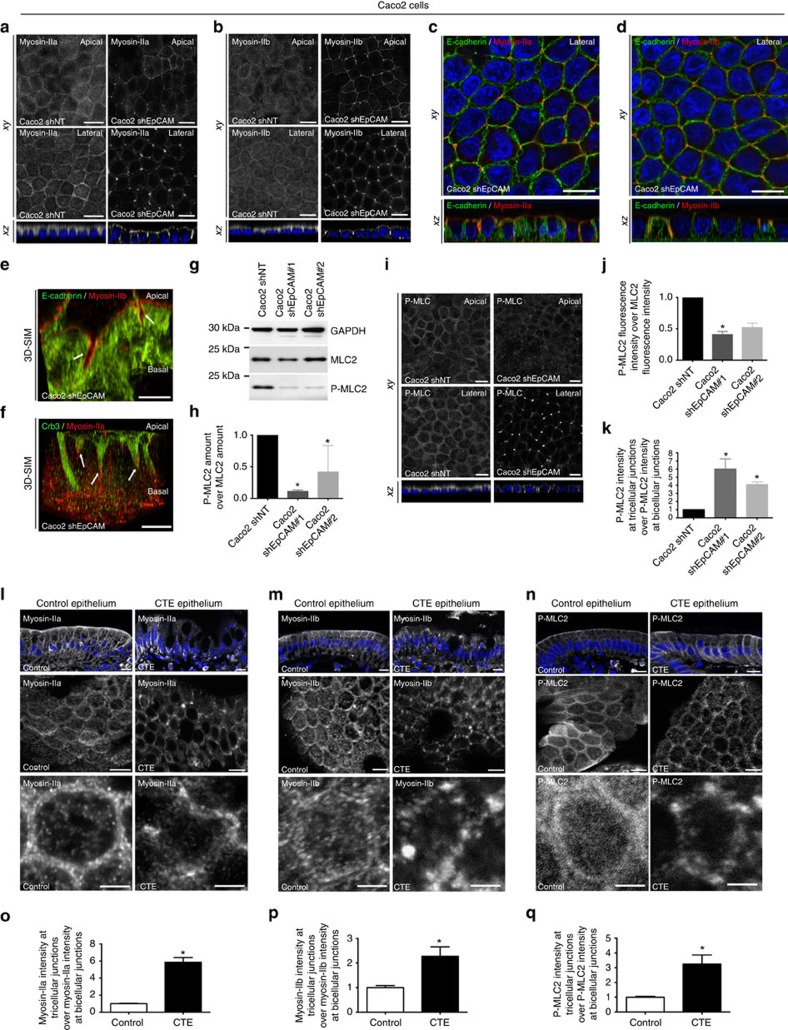
Figure 5. Exacerbation of contractile forces at TCs on EpCAM loss.
(a,b) Distribution of myosin-IIa and -IIb in control and EpCAM-depleted cells. Scale bars, 5 μm. (c,d) Distribution of E-cadherin and myosin-IIa, or E-cadherin and myosin-IIb in EpCAM-depleted cells. Scale bars, 5 μm. (e,f) 3D-SIM analysis of E-cadherin and myosin-IIb, or Crb3 and myosin-IIa in EpCAM-deprived cells. Scale bars, 5 μm. (g) Western blot analysis of MLC2 and P-MLC2 amounts in control and EpCAM-depleted cells. GAPDH was used as loading control. (h) Quantification of P-MLC2 amount relative to MLC2 in control and EpCAM-depleted cells. One-way ANOVA with Dunnett's test, *P<0.01. Caco2shNT=1, Caco2shEpCAM#1=0.11±0.2, Caco2shEpCAM#2=0.42±0.2. (i) Distribution of P-MLC2 in control or EpCAM-silenced cells. Scale bars, 5 μm. (j) Quantification of total P-MLC2 immunofluorescence intensity relative to MLC2 immunofluorescence intensity in control or EpCAM-depleted cells. One-way analysis of variance test with Dunnett's test, *P=0.007, **P=0.002. n(Caco2shNT)=30 cells, n(Caco2shEpCAM#1)=30, n(Caco2shEpCAM#2)=30. Caco2shNT=1, Caco2shEpCAM#1=0.4±0.05, Caco2shEpCAM#2=0.52±0.07. (k) Quantification of P-MLC2 immunofluorescence intensity at TCs relative to immunofluorescence intensity at bicellular junctions (BJs) in control or EpCAM-depleted cells. One-way analysis of variance with unpaired t-test, *P=0.0001. n(Caco2shNT)=30 cells, n(Caco2shEpCAM#1)=28, n(Caco2shEpCAM#2)=30. Caco2shNT=1, Caco2shEpCAM#1=6.01±1.24, Caco2shEpCAM#2=4.1±0.33. (l–n) Distribution of myosin-IIa, -IIb and P-MLC2 in control or CTE biopsies. Scale bars, 5 μm. N(Control)=3 biopsies, N(CTE)=3. (o–q) Quantification of myosin-IIa, -IIb or P-MLC2 immunofluorescence intensity at TCs relative to immunofluorescence intensity at BJs in control or CTE biopsies. N(Control)=3 biopsies, N(CTE)=3. Unpaired t-test, (o) *P<0.0001, (p) *P=0.0062, (q) *P=0.0016. n(Control myosin-IIa)=37 cells, n(CTE myosin-IIa)=29, n(Control myosin-IIb)=14, n(CTE myosin-IIb)=14, n(Control P-MLC2)=15, n(CTE P-MLC2)=21. Myosin-IIa(Control)=1±0.04, myosin-IIa(CTE)=5.86±0.54, myosin-IIb(Control)=1±0.08, myosin-IIb(CTE)=2.27±0.39, P-MLC2(Control)=1±0.07, P-MLC2(CTE)=3.25±0.62. For quantification, three independent replicates have been performed. Values are mean±s.e.m. Nuclei were stained with Hoechst 33342.

