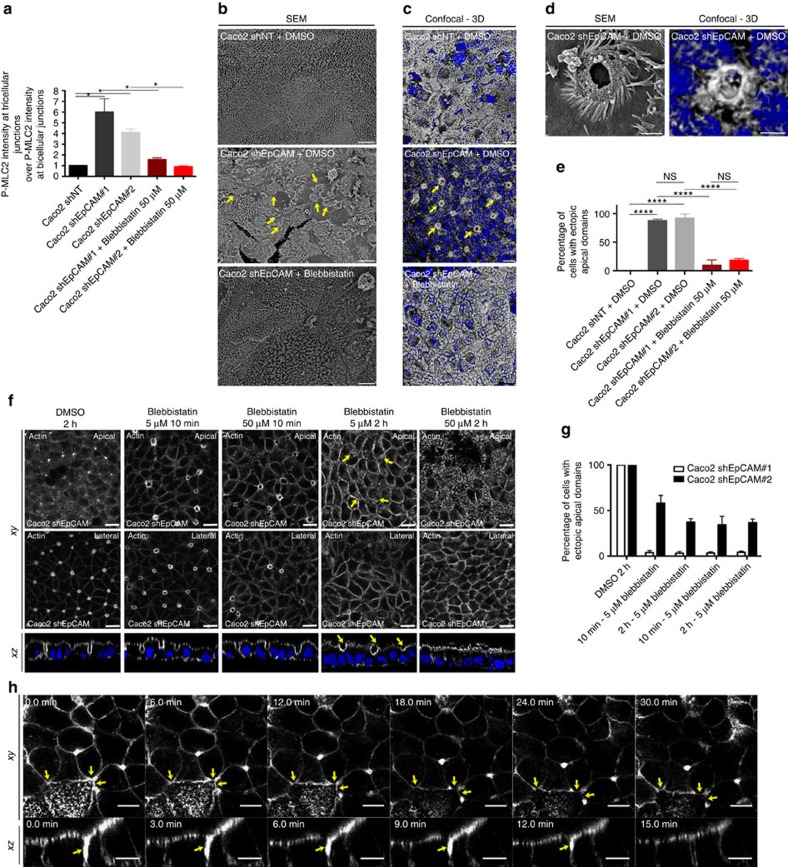
Figure 6. Apical domain positioning is restored on cell contractility decrease.
(a) Quantification of P-MLC2 immunofluorescence intensity at TCs relative to immunofluorescence intensity at BJs in control, EpCAM-depleted or 2h-blebbistatin-treated EpCAM-depleted cells. One-way analysis of variance with unpaired t-test, *P<0.05. n(Caco2shNT)=30 cells, n(Caco2shEpCAM#1)=28, n(Caco2shEpCAM#2)=30, n(Caco2shEpCAM#1+Blebbistatin 50 μM)=31, n(Caco2shEpCAM#2+Blebbistatin 50 μM)=30. Caco2shNT=1, Caco2shEpCAM#1=6.01±1.24, Caco2shEpCAM#2=4.1±0.33, Caco2shEpCAM#1+Blebbistatin 50 μM=1.57±0.17, Caco2shEpCAM#2+Blebbistatin50 μM=0.91±0.06. (b) SEM analyses of apical surfaces of DMSO-treated control, EpCAM-depleted or EpCAM-depleted cells treated with blebbistatin for 2 h. Scale bars, 4 μm. (c) Confocal analysis and 3D rendering of z-stacks of actin location at TCs in DMSO-treated control, EpCAM-depleted or EpCAM-depleted cells treated with blebbistatin for 2 h. Scale bars, 4 μm. (d) High magnifications of EADs from SEM or confocal and 3D rendering analyses. Scale bars, 1 μm. (e) Quantification of EADs on DMSO or blebbistatin treatment in Caco2shNT or shEpCAM cells. One-way ANOVA with Tukey's test, ****P<0.0001. n(Caco2shNT+DMSO)=107 cells, n(Cao2shEpCAM#1+DMSO)=105, n(Caco2shEpCAM#2+DMSO)=91, n(Caco2shEpCAM#1+Blebbistatin)=96, n(Caco2shEpCAM#2+Blebbistatin)=81. EAD-positive Caco2shNT cells=0%, EAD-positive Caco2shEpCAM#1+DMSO cells=87.41±1.64%, EAD-positive Caco2shEpCAM#1+DMSO cells=91.98±4.21%, EAD-positive Caco2shEpCAM#1+blebbistatin cells=9.55±5.46%, EAD-positive Caco2shEpCAM#1+DMSO=18.43±1.83%. (f) Confocal analysis of actin distribution and brush border formation in Caco2shEpCAM cells. Cells were treated for 2 h with DMSO, or for 10 min or 2 h with 5 or 50 μM of blebbistatin. Scale bars, 5 μm. (g) Quantification of EADs on DMSO or blebbistatin treatment in Caco2 shEpCAM cells. N(2 h, DMSO)=5,467 cells, N(10 min, 5 μΜ)=3,598, N(10 min, 50 μΜ)=4,032, N(2 h, 5 μΜ)=289, N(2 h, 50 μΜ)=4,416. t-test, P<0.0001. (h) Analysis of lateral membrane behaviour in EpCAM-deprived Caco2 cells during 50 μM blebbistatin treatment and time-lapse acquisitions. Lateral membranes have been stained with SirActin labelling. Scale bars, 10 μm. For quantification, three independent replicates have been performed. Values are mean±s.e.m. Nuclei were stained with Hoechst 33342.

