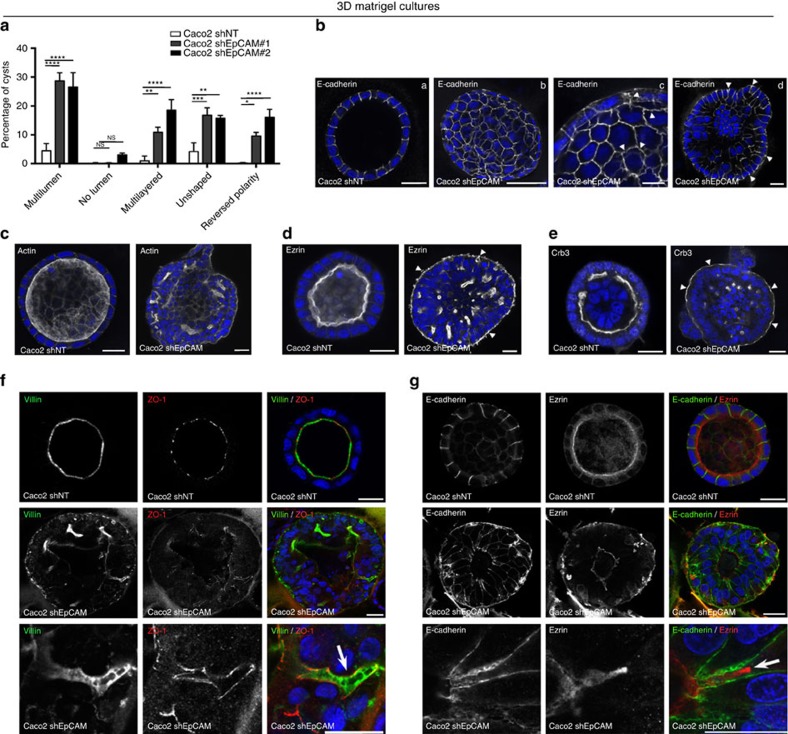
Figure 7. Epithelial organization in 3D Matrigel cultures is perturbed on EpCAM loss.
(a) Statistical analysis of cyst morphology in Caco2 shNT (white), Caco2 shEpCAM#1 (grey) and Caco2 shEpCAM#2 (black) cells. Three independent experiments were performed. N(Caco2shNT)=779 cysts, N(Caco2shEpCAM#1)=1,049 cysts, N(Caco2shEpCAM#2)=1,686 cysts. Unpaired t-tests, ****P<0.0001, ***P<0.001, **P<0.01, *P<0.1. Percentage of Caco2shNT cells with multilumen cysts=4.5±2.5%, no lumen cysts=0.13±0.2%, multilayered cysts=0.9±1.7%, unshaped cysts=4.1±3.0% and reversed polarity cysts=0.2±0.2%. Percentage of Caco2shEpCAM#1 cells with multilumen cysts=28.6±4.9%, no lumen cysts=0.2±0.3%, multilayered cysts=10.9±3.0%, unshaped cysts=16.7±4.5% and reversed polarity cysts=9.6±2.2%. Percentage of Caco2shEpCAM#2 cells with multilumen cysts=26.6±8.5%, no lumen=3.0±1.1%, multilayered cysts=18.5±6.3%, unshaped cysts=15.8±1.5% and reversed polarity cysts=16.1±4.7%. Values are mean±s.d. (b–e) Confocal analysis of E-cadherin (b), actin (c), ezrin (d) and Crb3 (e) in 21 days 3D Matrigel cultures of control (Caco2 shNT) and EpCAM-silenced (Caco2 shEpCAM) cells. (b(c)) Arrowheads point toward weakened E-cadherin-based cell adhesions. (b(d)) Arrowheads point toward basal redirection of lateral E-cadherin. (d–e) Arrowheads point toward apical marker mislocalization on the outer side of the cysts, reflecting the loss of apico-basal polarity in shEpCAM cells. Nuclei were detected with Hoechst 33342 staining (blue). Scale bars, 10 μm. (f,g) Confocal analysis of double immunostainings for villin (green) and ZO-1 (red) (f), or E-cadherin (green) and ezrin (red) (g) in 21 days 3D Matrigel cultures of control (Caco2 shNT) and EpCAM-silenced (Caco2 shEpCAM) cells. Higher magnifications on EADs are presented in the lower panels. Nuclei were detected with Hoechst 33342 staining (blue). Scale bars, 20 μm.

