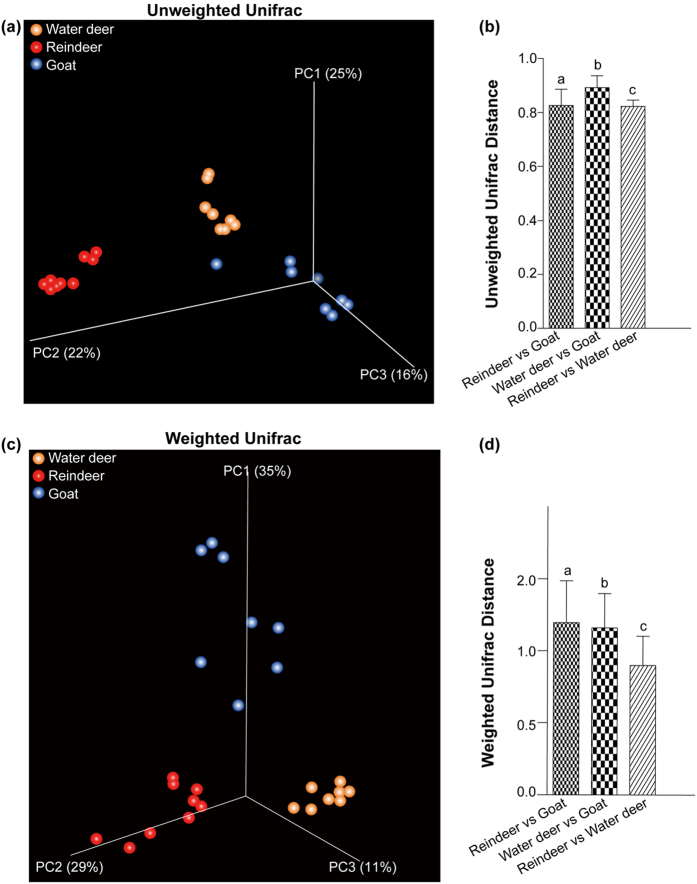
Figure 2. Comparisons of the bacterial communities in the milk of Water deer, Reindeer and Goat.
Principal coordinate analyses based on unweighted UniFrac distances (a) and average distance differences among groups (b). Bar plots labeled with different letters (a, b, and c) denote UniFrac distances between and within three hosts (Water deer, Reindeer, and Goat) are significantly different (Kruskal-Wallis tests, FDR-adjusted q < 0.05). (c and d) Principal coordinate analyses based on weighted Unifrac distances (d) and average distance differences among the three hosts (d).

