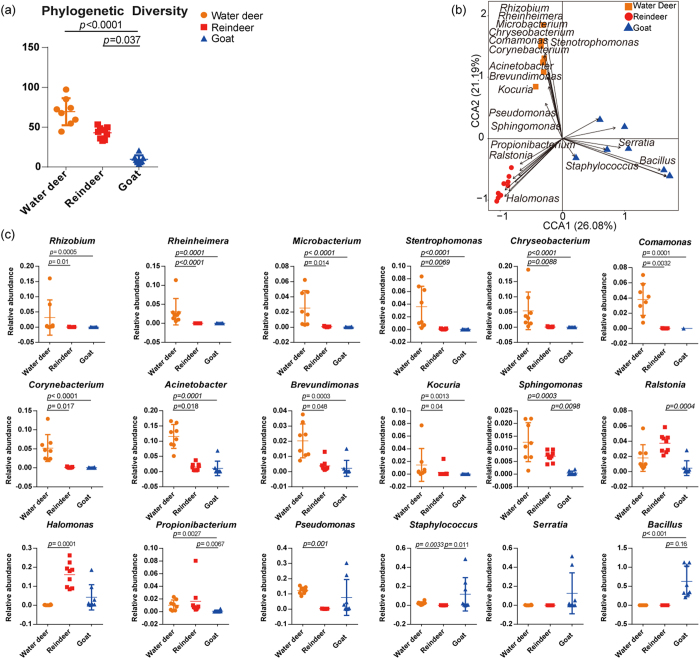
Figure 3. Features characterizing the milk bacteria of Water deer, Reindeer and Goat.
(a) Phylogenetic diversity comparisons. (b) Correspondence analysis (CA) showing indicator genera driving the differences of milk bacteria across all three hosts. The distance between vectors (arrows), and the symbols (circles, squares, and diamonds) that represent each taxon give an estimate of the taxon’s relative abundance in a given sample. (c) Boxplots showing differences in the relative abundance of some indicator genera driving milk bacterial differences among the Water deer, Reindeer and Goat.

