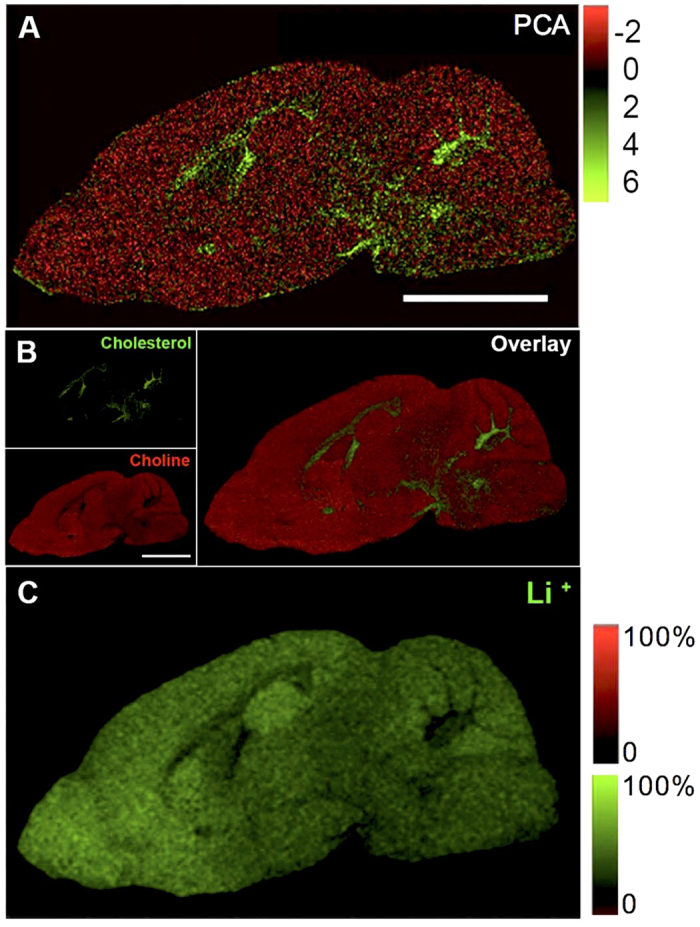
Figure 1. Multivariate Image analysis identified anatomical regions of interest.

PCA and single ion images from one representative animal. (A) Score image for the first principal component obtained from PCA of the imaging data illustrating the major chemical differences of distinct anatomical regions. (B,C) From the corresponding loadings, the variables (m/z) that contribute the most to variance can be identified. These localize to different anatomical regions that can hence be delineated based on their chemical identity. These include, choline (B upper left), m/z = 104.1, [C5H14NO+], gray matter), cholesterol (B lower left), m/z = 369.33, [C27H45+], white matter) and the overlay (B on the right): choline (red) and cholesterol (green) and Li+ (C, m/z = 7). Scale bar = 2 cm.
