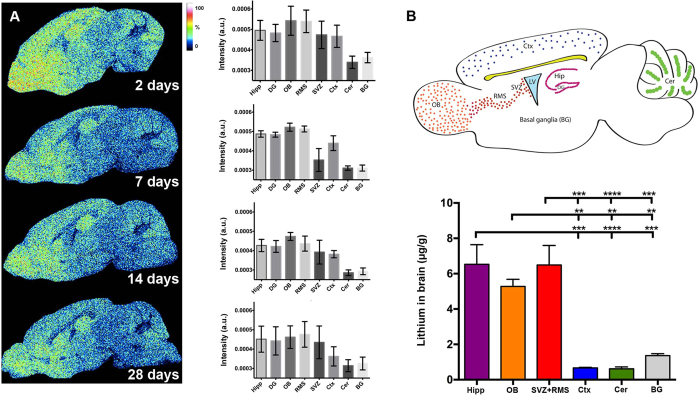
Figure 2. Region-selective lithium uptake following continuous treatment.
(A) Single ion images from one representative animal per group for m/z 7 [Li+] at different time points. A characteristic decrease was observed in various anatomical regions at day 14 and 28 compared to day 2. This was particularly prominent in the cerebellum and cortex. (B) (Upper panel) Representative color-coded schematic image of a sagittal section of the mouse brain showing the ROIs identified by ToF-SIMS. Ctx = cortex, Cer = cerebellum, BG = basal ganglia, DG = dentate gyrus, Hip = hippocampus, LV = lateral ventricle, SVZ = subventricular zone, RMS = rostral migratory stream and OB = olfactory bulb. (Lower panel) ICP-AES quantification confirmed lithium-selective uptake in specific ROIs of the brain: SVZ+RMS, hippocampus and OB had significantly higher Li+ concentrations as compared to BG, cortex and cerebellum. ***p = 0.0001, ****p < 0.0001, pOBvsBG = 0.0085, pOBvscerebellum = 0.0015 and pOBvscortex = 0.0017.

