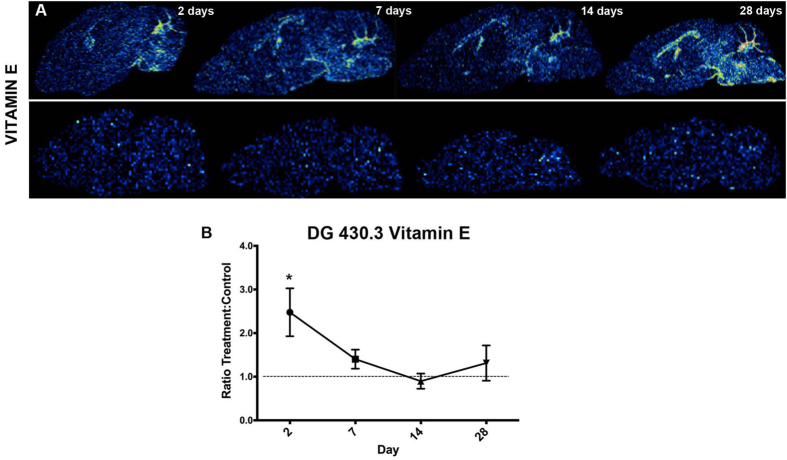
Figure 7. Vitamin E levels were transiently altered during lithium treatment.
(A) Single ion images for vitamin E (m/z 430.33, alpha tocopherol, [C29H50O+]) at different time points during the lithium treatment (top) and in the control (bottom) group. (B) The levels of vitamin E (m/z 430.33) were elevated at day 2 in the dentate gyrus (DG), but leveled out at the later time points.

