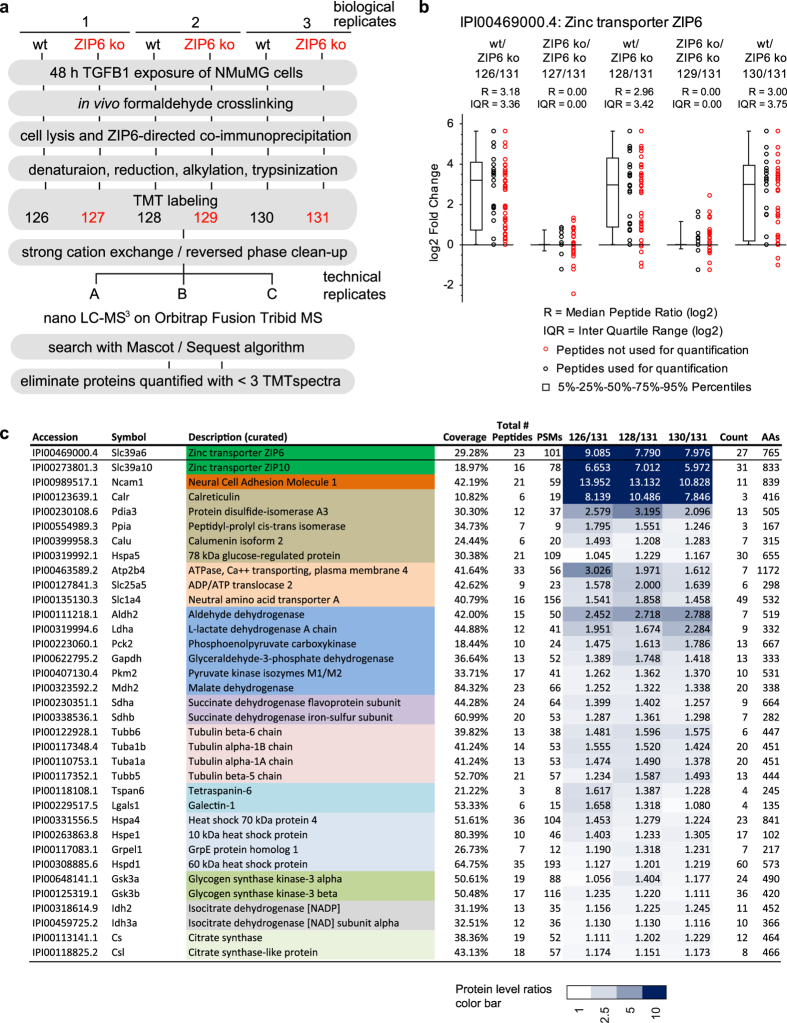
Figure 2. The ZIP6 interactome.
(a) Chart depicting workflow of ZIP6 interactome analysis using wild-type or ZIP6 ko NMuMG cells as biological starting material. (b) Relative quantitation of ZIP6 levels in ZIP6 co-immunoprecipitations (co-IPs) from in vivo formaldehyde crosslinked wild-type and ZIP6 ko NMuMG cells in mass spectrometry dataset described in Panel ‘a’. Box plot depicting in log2 space enrichment ratios of individual ZIP6 peptides used for quantitation, as well as the median peptide ratio and Inter Quartile Range (IQR). A subset of peptides (indicated with red circles) was automatically eliminated from the quantitation because their identification was redundant or mass spectrometry profiles underlying their identification did not pass stringency thresholds. Note that in this and other box plots or tables in this paper relative protein levels are depicted as ratios, with ion intensities of the heaviest isobaric labels within multiplex analyses serving as the reference (denominator). (c) Truncated list of proteins enriched in ZIP6-specific co-IPs analyzed as described in Panel ‘a’. Colors identify proteins with related function and/or localization. The full table, including levels of these proteins in negative control samples, is shown in Supplementary Table S1.

