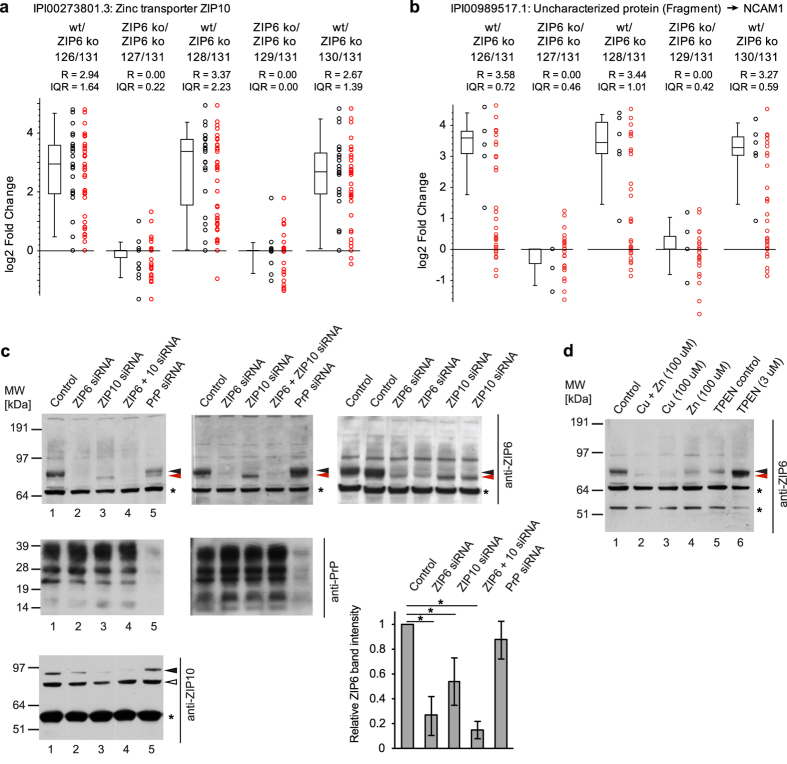
Figure 3. Interdependent assembly of a ZIP6-ZIP10 heteromeric complex that interacts with NCAM1.
(a) Relative quantitation of endogenous ZIP10 levels in ZIP6 co-IPs from in vivo formaldehyde crosslinked wild-type and ZIP6 ko NMuMG cells. The box plot depicts in log2 space the enrichment ratios of individual ZIP10 peptides used for quantitation, as well as the median peptide ratio and Inter Quartile Range (IQR). See Fig. 2b for full legend and explanation of symbols. (b) Relative quantitation of NCAM1 in multiplex ZIP6 interactome dataset. (c) ZIP6 and ZIP10 interact and regulate each other’s expression also in Neuro 2a mouse neuroblastoma cells. Note the reproducible change in migration of ZIP6 bands upon knockdown of ZIP10, which may indicate an effect of ZIP10 on the post-translational modification or maturation of ZIP6 (the differences in band migration are demarked by red and black arrowheads). The graph depicts the results of densitometric analyses of band intensities (identified by filled arrow heads) from three independent analyses. Asterisks indicate cross-reactive bands. The open arrowhead indicates a band of uncertain identity. (d) Addition of copper or zinc to the cell culture medium of Neuro 2a cells mimics siRNA-based knockdown with regard to its effect on ZIP6 protein levels. In contrast, chelation of divalent cations by exposure of cells to TPEN causes an increase in steady-state ZIP6 protein levels. Because the treatment with TPEN required this chelator to be dissolved in ethanol, a separate negative control sample of cells exposed to an identical concentration of ethanol in the medium, designated as ‘TPEN control’, was included in the analysis.

