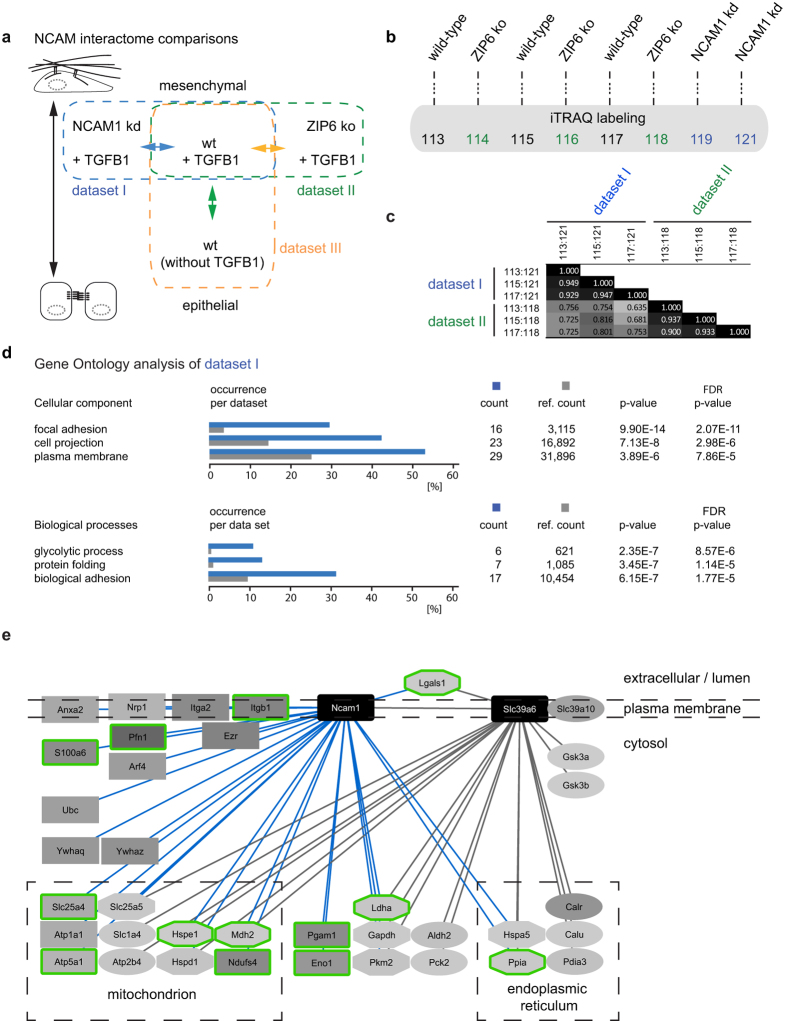
Figure 4. The NCAM1 interactome.
(a) Design of three multi-plex NCAM1 comparative interactome analyses conducted in this study. Dataset I served the identification of NCAM1 interactors in TGFB1-treated NMuMG cells; Dataset II investigated the effect of ZIP6 ko on the NCAM1 interactome; and Dataset III studied the effect of epithelial-to-mesenchymal transition on the NCAM1 interactome. (b) The experimental design followed the workflow outlined in Fig. 2a. However, eight-plex iTRAQ labeling was employed to be able to generate Datasets I and II in one combined analysis. (c) Comparison of interactomes generated in Datasets I and II by Pearson correlation analysis. Note that biological replicates within Datasets I and II generated a Pearson coefficient near 1, indicating excellent biological and technical reproducibility of interactomes. A direct of comparison of Datasets I and II also returned Pearson coefficients >0.5, indicating a direct correlation, which suggests that the presence of ZIP6 promotes NCAM1 binding to a subset of its natural interactors. (d) Gene Ontology analysis of Dataset I. (e) Schematic depiction of ZIP6 and NCAM1 interactomes. The figure was originally generated in Cytoscape but nodes were subsequently rearranged to indicate the known predominant cellular compartments in which interactors reside. The intensity of grey shading correlates directly with the relative enrichment levels of interactors. Rectangular and oval node shapes identify NCAM1 and ZIP6 interactors, respectively. Octagonal shapes indicate the presence of a given interactor in both NCAM1 and ZIP6 interactome datasets. Nodes with green boundaries identify NCAM1 interactors whose presence in the NCAM1 interactome was most affected (>three-fold) by the presence or absence of ZIP6.

