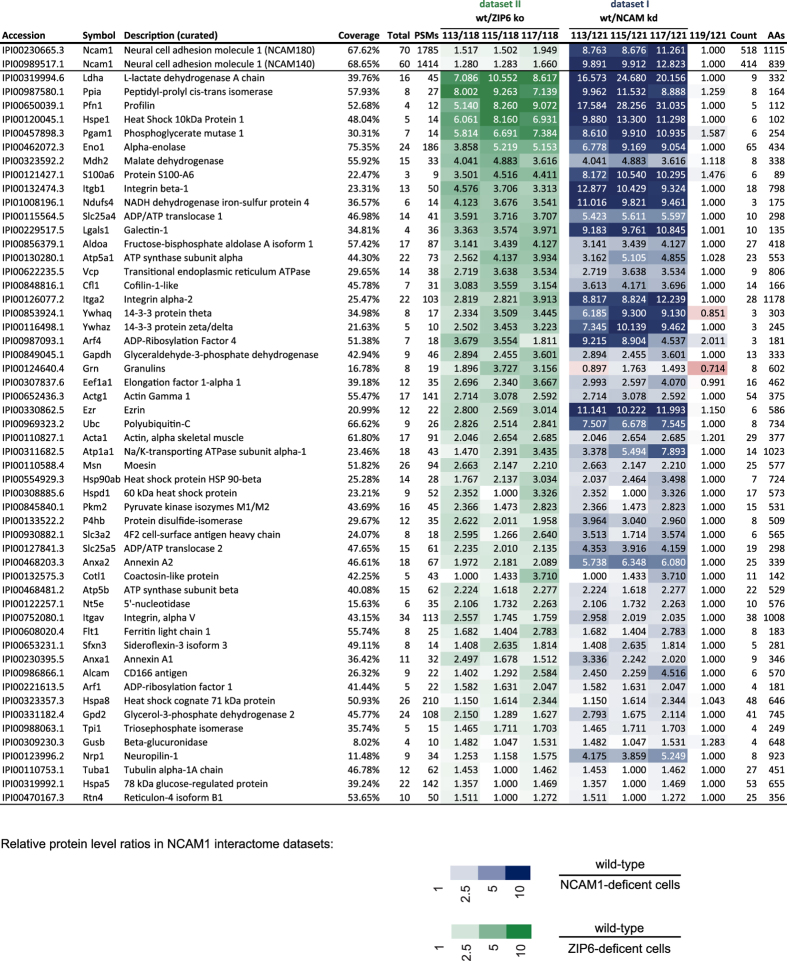
Figure 5. Effect of ZIP6 on the NCAM1 interactome.
Subset of interactome data from Datasets I and II generated and labeled as described in Fig. 4a and b. NCAM1 interactors shown are sorted to reflect the influence of ZIP6 on the NCAM1 interactome, i.e., interactors, whose co-enrichment with NCAM1 was most affected in a direct comparison of NCAM1 interactome data generated from wild-type and ZIP6 ko, are listed first. Note that the Proteome Discoverer software used to compute the relative abundance ratios was configured to replace missing values in individual channels with minimum intensities observed. Because most NCAM1 interactors were absent from the negative control samples labeled with iTRAQ reagents 119 and 121, this configuration caused a majority of median iTRAQ 119/121 signature ion intensity ratios to give rise to a value of 1.

