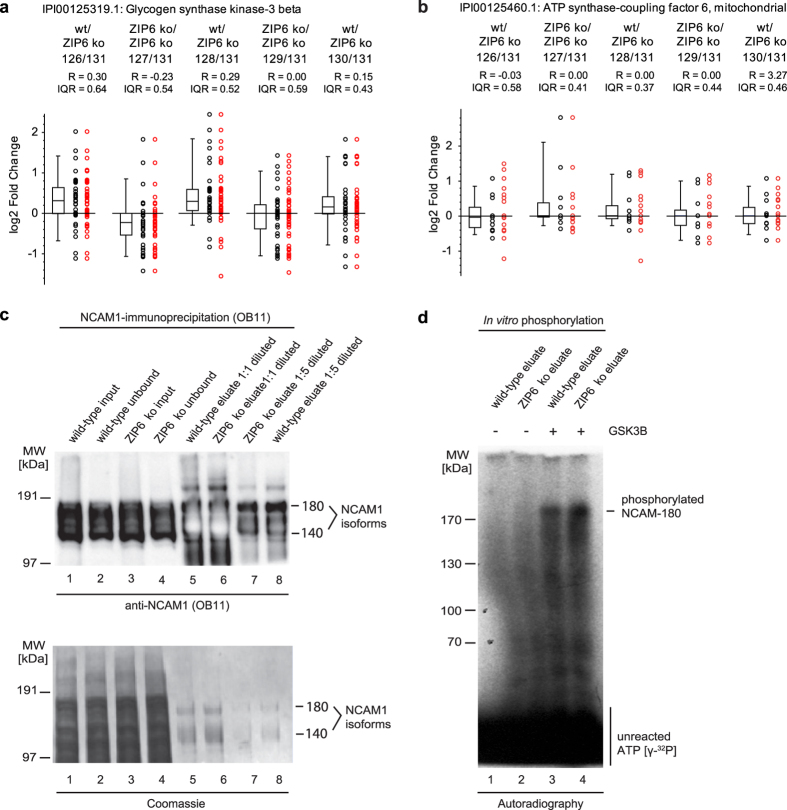
Figure 8. In vitro phosphorylation of longest NCAM1 isoform by GSK3B.
(a and b) Box plots showing relative quantitations of glycogen synthase kinase 3 beta (GSK3B) and ATP synthase coupling factor 6 (ASCF6) in NCAM1 interactomes generated with wild-type or ZIP6 ko cells. Whereas GSK3B protein levels in the NCAM1 interactome correlated directly with the presence or absence of ZIP6, ASCF6 protein level ratios were similar in all samples, consistent with unspecific binding of this protein to the affinity capture matrix. (c and d) Evidence of NCAM-180 in vitro phosphorylation by GSK3B. (c) Immunoprecipitation of NCAM1 from cellular extracts of NMuMG cells, which had been induced to undergo EMT by 48 h addition of TGFB1 to the cell culture medium. The OB11 antibody used in this experiment for immunoprecipitation and Western blot detection binds to a cytosolic epitope shared by NCAM-140 and NCAM-180, which gave rise to the characteristic band pattern in Lanes 5 and 6. Note that due to its relatively higher abundance in eluate fractions, signals for NCAM-140 exceeded maximum intensity levels in lanes 5 and 6, leading to a partially inverted ‘white’ signal. (d) Autoradiographic analysis of in vitro GSK3B phosphorylation of NCAM1 immunoprecipitation eluates seen in Panel ‘c’. Note that although the signal detected at 180 kDa, corresponding to NCAM-180, has not been validated to consist of phosphorylated NCAM1, the Coomassie stain of the NCAM1 IP eluate fractions shown in Panel ‘c’ revealed no signals in the high mass region of the gel that could not be attributed to the expected NCAM-180 or NCAM-140 bands.

