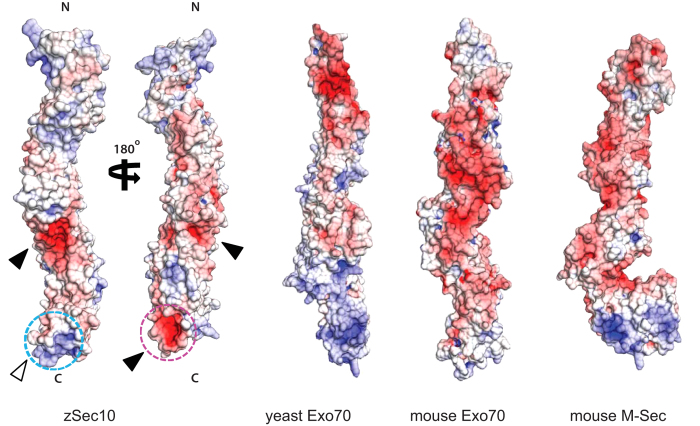
Figure 5. Electrostatic surface potential distribution of zSec10.
Electrostatic surface potential of zSec10, yeast Exo70, mouse Exo70 and mouse M-Sec on a scale from −10 kBT/e (red) to +10 kBT/e (blue). Black and white arrows indicate negatively and positively charged patches in the C-terminal half of zSec10, respectively. The potential interaction site for Arf6 and the conserved positively charged patch in the C-terminal end are encircled by purple and cyan dotted lines, respectively.

