
Figure 4.
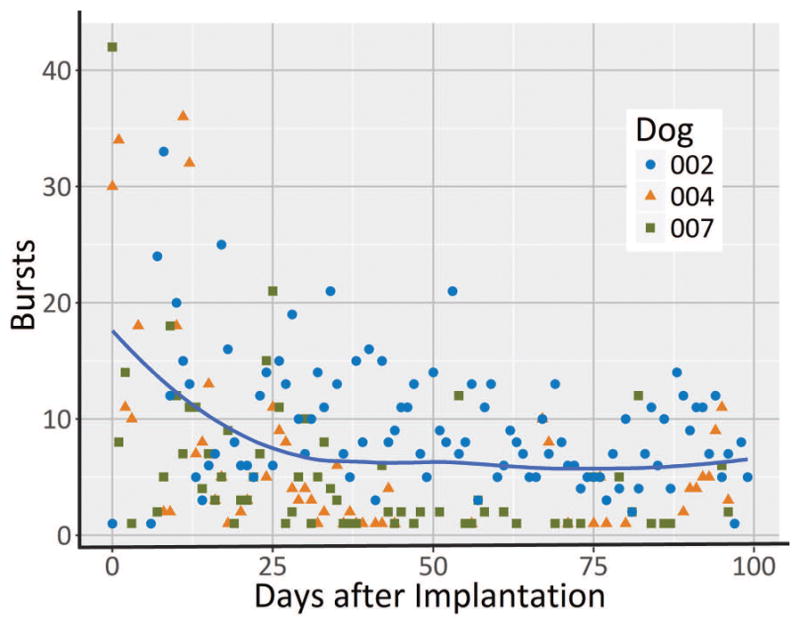
Average number of bursts per day for the first 100 days across three dogs (excluding dog with status epilepticus). The blue line represents the mean number of bursts across three dogs. A linear mixed model fit to log bursts show a significant decrease in burst count (p=0.03).