
Figure 5.
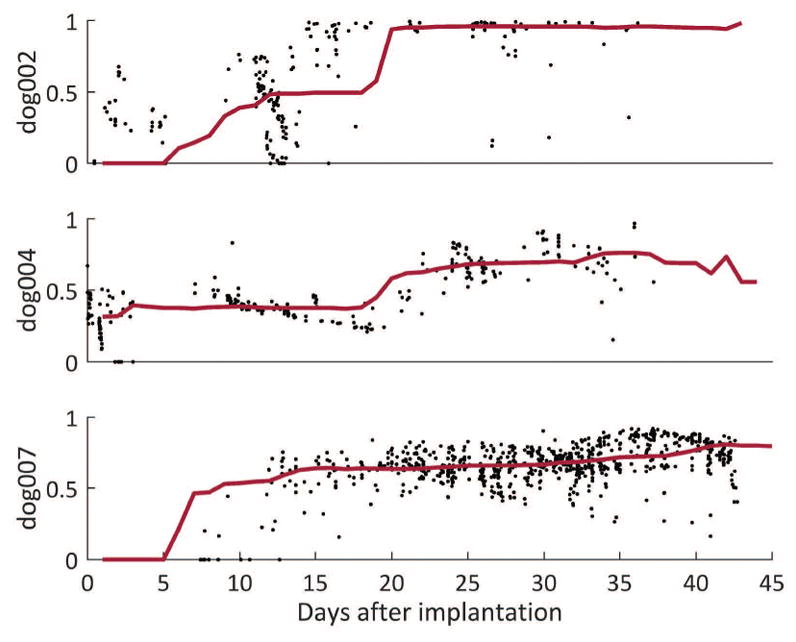
Normalized burst similarity in comparison with all future bursts in three dogs over the first 45 days of recording. Black points represent the similarity of the burst at that time point to future bursts. The red line denotes the median similarity within a 2-week moving window. High similarity represents a value of 1. Of note, early bursts are dissimilar to later bursts and that similarity levels off ~20 days.