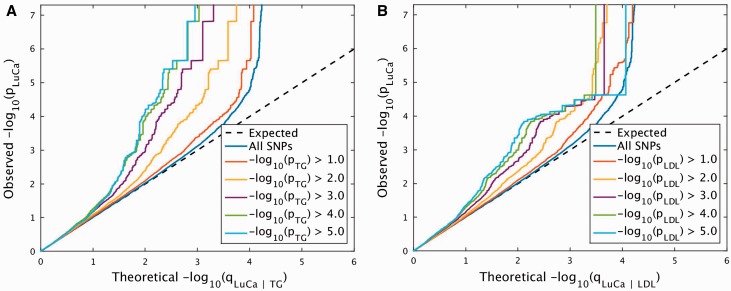
Figure 1.
Conditional Q-Q plots: lung cancer (LuCa) | cardiovascular disease (CVD) factors (triglycerides [TG] and low-density lipoproteins-cholesterol [LDL-C]). ‘Conditional Q-Q plot’ of theoretical vs empirical -log10 P values (corrected for genomic control ) in LuCa below the standard GWAS threshold of -log10 P values equal to 7.3 (equals P values above 5 x 10⁻⁸) as a function of statistical significance of association with (A) TG and (B) LDL-C at the levels of P < 1.00, P < .10, P < .01, P < .001, P < 1.00x10⁻⁴, P < 1.00x10⁻⁵, respectively. Dotted lines indicate the theoretical line in case of no association. All statistical tests were two-sided.

