Fig. 2.
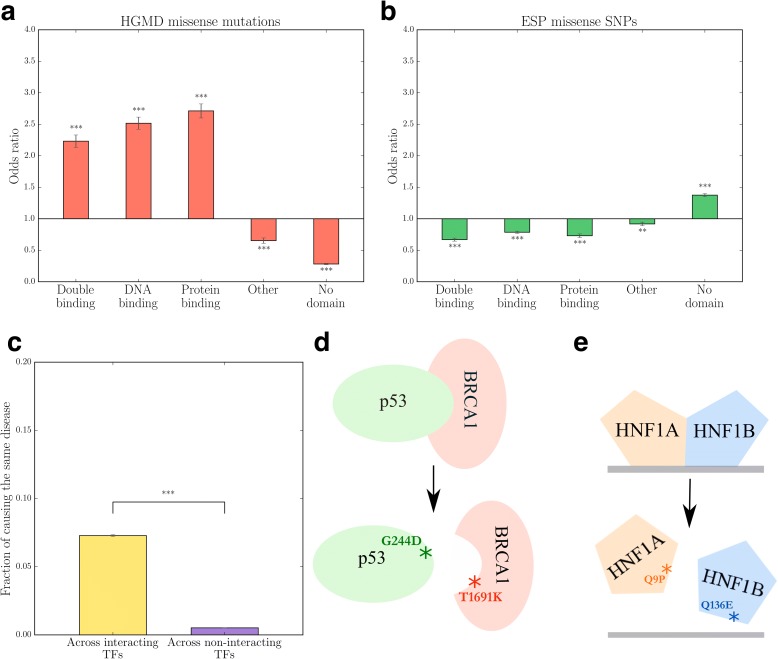
Analysis of disease-causing missense mutations on transcription factors. a Odds ratio for the distribution of transcription factor HGMD missense mutations in different interaction interfaces. ***P < 10–3. P values calculated using the Z-test on log odds ratio. Error bars indicate ± standard error (SE). b Odds ratio for the distribution of transcription factor ESP missense SNPs in different interaction interfaces. ***P < 10–3, **P < 10–2. P values calculated using the Z-test on log odds ratio. Error bars indicate ± SE. c Fraction of mutation pairs across two transcription factors causing the same disease. ***P < 10–3. Error bars indicate ± standard error of the mean (SEM). P values calculated using the cumulative binomial test. d Schematic diagram of a mutation pair causing the same disease across a TF-TF interaction interface. e Schematic diagram of a mutation pair causing the same disease where one mutation is on the TF-TF interaction interface while the other is on the TF-DNA interaction interface

