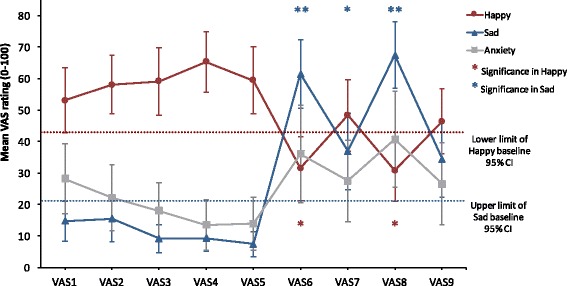
Fig. 2.

Mood induction effects on mood. Error bars represent the 95% confidence interval (CI). *,**, Significant difference from VAS1 (baseline) score (*p < 0.05, **p < 0.001, two-tailed); VAS1, baseline; VAS2, post-1st neutral memory recall (NR); VAS3, post-1st rest; VAS4, post-2nd NR; VAS5, post-2nd rest; VAS6, post-1st sad memory recall (SR); VAS7, post-3rd rest; VAS8, post-2nd SR; VAS9, post-4th rest
