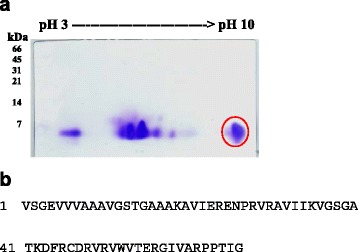
Fig. 3.

2-DE and LC-MS/MS analysis of protein constituents in TKE. a 2-DE. TKE was separated on pH 3-10 strips, followed by SDS-PAGE on 15% polyacrylamide gels. Proteins were visualized by Coomassie Brilliant Blue R-250. Protein size markers (in kDa) are shown on the left. Protein spot in red circle was excised and analyzed by LC-MS/MS. Photos are representative images of three independent experiments. b TKP sequences obtained by LC-MS/MS
