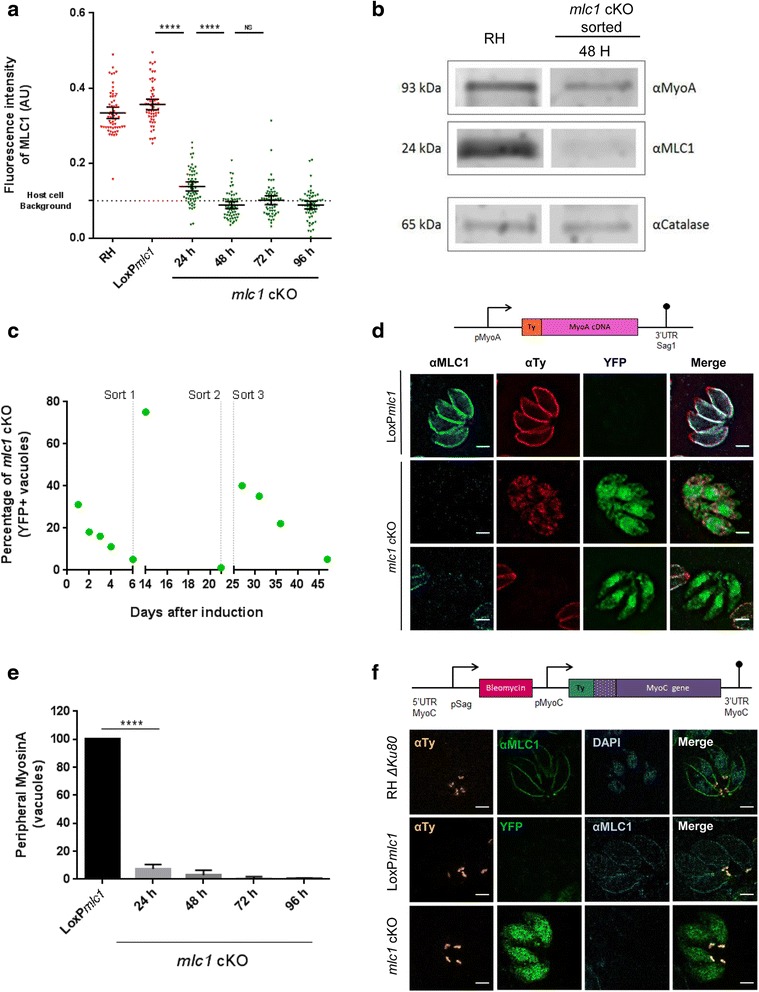
Fig. 6.

Parasites without MLC1 can be maintained in cell culture for several weeks. a MLC1 proteins levels were evaluated by measuring the fluorescence intensity of vacuoles stained with α-MLC1 at 0, 24, 48, 72 and 96 h post induction. Fluorescence intensity was analysed using CellProfiler software. The lower dashed line indicates the fluorescence background in the red channel obtained by using the YFP+ parasite strain without antibodies. Bars indicate mean with 95% confidence intervals. One-way ANOVA followed by Tukey’s post hoc test was used to compare means between groups. **** P < 0.0001, non-significance (ns) P > 0.05. b Western blot analysis of sorted mlc1 conditional knockout (cKO) parasites to determine the protein levels of MyoA and MLC1. Catalase was used as loading control. c mlc1 cKO culture maintenance. Long term viability of YFP+ mlc1 cKO was assayed using FACs sorting. Six days after induction, parasites were sorted for YFP+ signal, which results from excision of the mlc1 gene, and put back in culture. Vertical dashed lines indicate three sequential sortings over time of the maintained mlc1 cKO culture. The population of mlc1 cKO/YFP+ vacuoles was counted in 20 fields of view using 40× objective, and expressed as a percentage value over total number of vacuoles in different time points. d Depletion of MLC1 results in mislocalisation and absence of MyoA from the inner membrane complex. Top panel: Scheme of pMyoA-Ty-MyoA plasmid that was randomly integrated into either the RH Δhxgprt or LoxPmlc1 genome. MyoA cDNA was fused to a Ty tag under the pMyoA promoter. Bottom panel: Immunofluorescence analysis of Ty-tagged MyoA in RH Δhxgprt and mlc1 cKO parasites using α-Ty and α-MLC1 antibodies. e Percentage of mlc1 cKO parasites expressing correctly localised MyoA using Ty-MyoA at 0, 24, 48 72 and 96 h after induction. Graphic shows mean ± standard deviation of three independent experiments. One-way ANOVA followed by Tukey’s post hoc test was used to compare means between groups. **** P < 0.0001. f Evaluation of MyoC localisation in the mlc1 cKO. Top panel: scheme of the endogenous MyoC tagging plasmid. Bottom panel: Immunofluorescence analysis of Ty-tagged MyoC in RH Δhxgprt, LoxPmlc1 and mlc1 cKO parasites. Scale bar represents 2 μm
