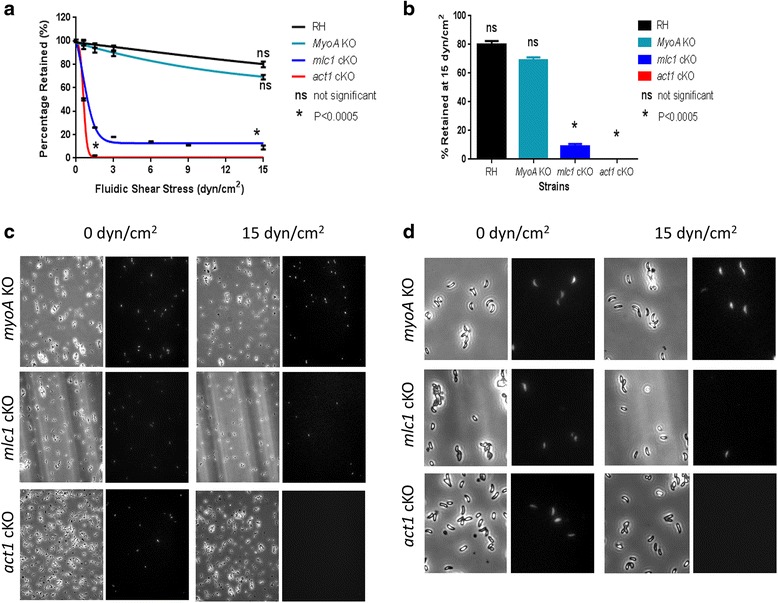
Fig. 9.

Attachment under fluidic shear stress. Evaluation of attachment under fluidic shear stress. a Percentage of parasites retained under fluidic stress relative to zero flow for RH, myoA knockout (KO), mlc1 conditional knockout (cKO) and act1 cKO strains. Data accumulated from n = 4 experiments for each strain, trendline ± standard deviation shown. b Bar graph showing relative percentage of parasites retained after 15 dyn/cm2 fluidic shear stress. The dataset was compared with a two-tailed Student’s t-test: ns, non-significant and * P < 0.0005. c Representative images at 0 and 15 dyn/cm2 fluidic shear stress. d Magnified inset of panel (c) showing individual parasites. Internal controls were used for comparison in each experiment. myoA KO: myoA KO non-fluorescent and GFP fluorescent RH control, mlc1 cKO: mlc cKO YFP fluorescent and non-fluorescent RH control, act1 cKO: act1 cKO YFP fluorescent and non-fluorescent RH control. Scale bar 100 μm
