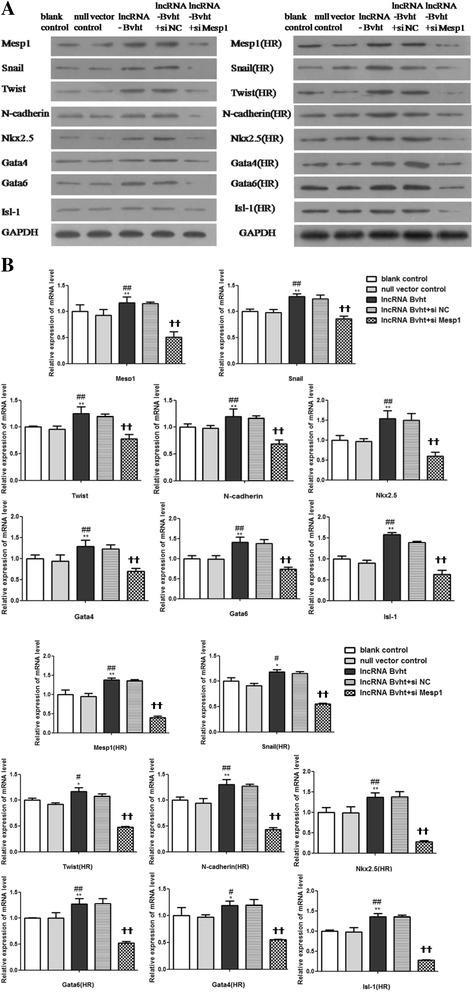
Fig. 6.

Expressions of cardiac-specific transcription factors and EMT-associated genes in different cell groups after the inhibition of Mesp1. Western blot (A) and quantitative real-time PCR (B) analysis of cardiac-specific transcription factors and EMT-associated genes in different cell groups after the inhibition of Mesp1. HR hypoxia/reoxygenation. *P<0.05,**P<0.01, vesus blank control; #P<0.05, ##P<0.01, vesus null vector control; ☨P<0.05, ☨☨P<0.01, vesus lncRNA-Bvht
