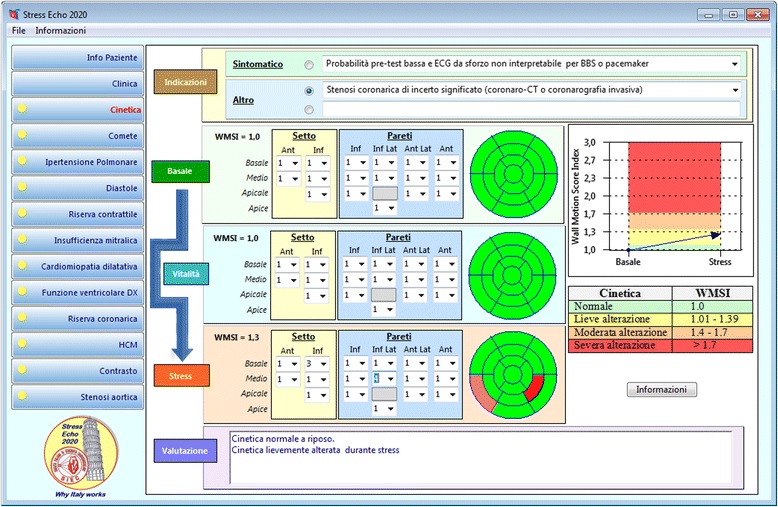
Fig. 2.

The computerized case report form for the regional wall motion abnormalities of the SE 2020 study. The grading of the response is reported in tabular (right side, lower panel) and graphic (right side, upper panel) format, with normal values of Wall Motion Score Index in green, mild impairment in yellow, moderate in orange, and severe impairment in red
