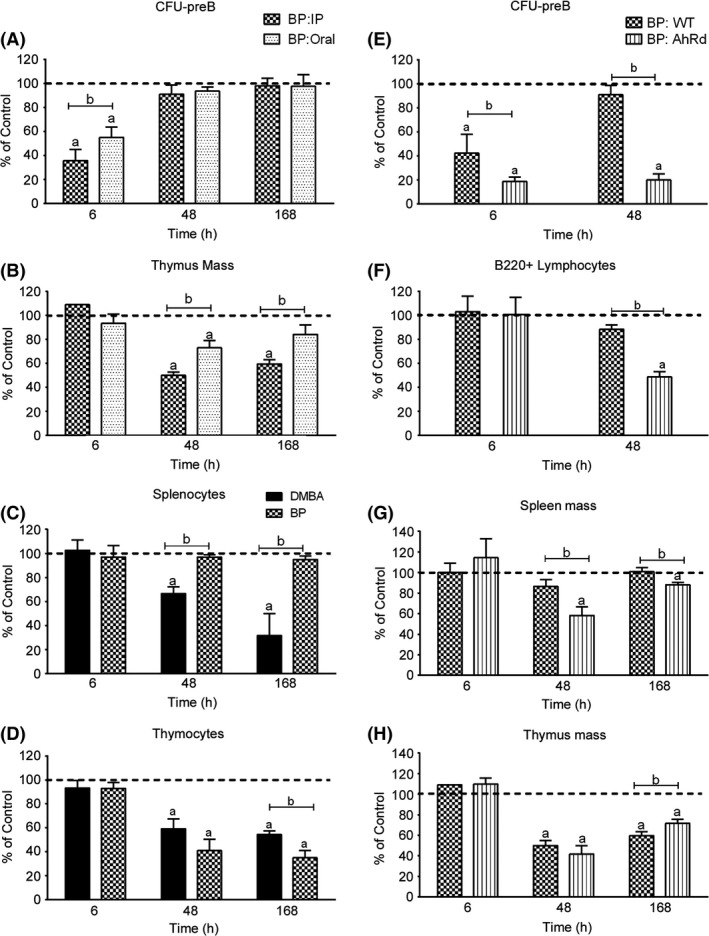
Figure 7.

Effects of BP administration on CFU‐preB activity, B220 lymphocytes, spleen mass and thymus mass. The response in AhRd mice demonstrates that BP‐mediated recovery of CFU‐preB activity and B220+ lymphocyte cellularity is dependent on the AhR. (A) BM CFU‐preB activity following oral or Intraperitoneal (IP) BP (50 mg/kg) administration. (B) Thymus mass following oral or IP BP (50 mg/kg) administration. (C) Comparison of the effect of IP BP and dimethylbenz(a)anthracene (DMBA) (50 mg/kg) administration on splenocytes, as measured by FACS analysis. (D) Comparison of the effect of IP BP and DMBA (50 mg/kg) administration on thymocytes, as measured by FACS analysis. (E) BM CFU‐preB activity in wild type (WT) and AhRd mice following IP BP (50 mg/kg) administration. (F) FACS quantification of BM B220+ lymphocytes in WT and AhRd mice following IP BP (50 mg/kg) administration. (G) Spleen mass in WT and AhRd mice following IP BP (50 mg/kg) administration. (H) Thymus mass in WT and AhRd mice following IP BP (50 mg/kg) administration. The results in each panel are expressed as percent of values in vehicle‐treated (olive oil) WT control mice (set at 100%), and are the mean ± SEM of 3–4 mice per group. Significant differences (P < 0.05) between control and BP treatment is denoted by the letter “a”, whereas “b” denotes significant differences (P < 0.05) between PAHs, routes of administration or mouse strains.
