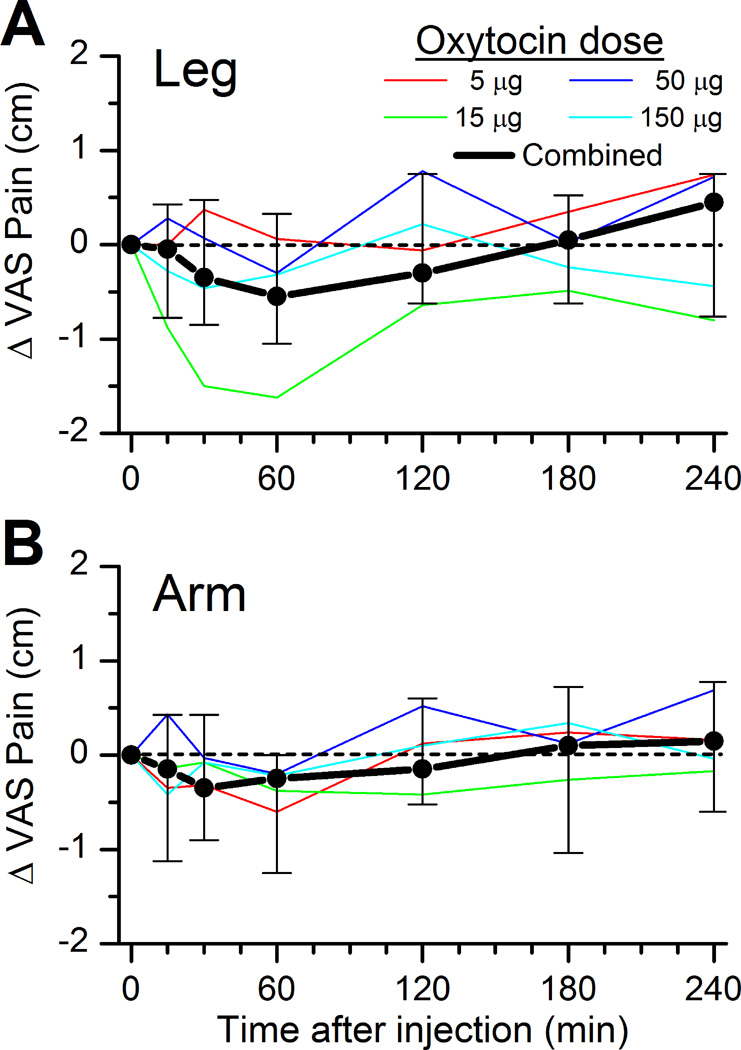
Figure 3.
Change in average of the pain intensity report on a 10 cm visual analog scale (VAS) to 5 sec stimuli at 49° and 51°C on the A) leg or B) arm before and after spinal injection of different doses of oxytocin. Thin lines represent the median of 5 individuals, and the thick line represents the median ± interquartile range of the population. No significant effect of time or dose.

