Figure 5.
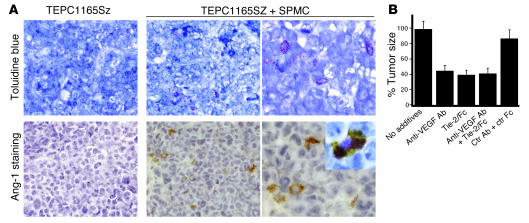
Contribution of Ang-1–secreting mast cells to plasmacytoma tumor growth. (A) Tumor tissues were stained with toluidine blue for detection of mast cells and/or immunostained with Tie-2/Fc for detection of Ang-1. Top row: Representative tumor tissue from a mouse inoculated with TEPC1165SZ plasmacytoma cells alone, showing no toluidine-positive cells (original magnification, ×20), and from a mouse inoculated with TEPC1165SZ cells plus SPMCs, showing infiltration with toluidine-positive cells (original magnifications, ×20 and ×40). Bottom row: Immunostaining for Ang-1 fails to detect positive cells in representative tumor tissue from a mouse inoculated with TEPC1165SZ cells alone, but detects scattered Ang-1–positive (brown) cells in a representative tumor tissue from a mouse inoculated with SPMCs (original magnification, ×20 and ×40). Inset: Cell colocalization of toluidine blue staining and Ang-1 immunostaining (original magnification, ×63). (B) Tumor size in mice injected s.c. with TEPC1165SZ plus BMMCs alone, Tie-2/Fc (50 μg per mouse), goat anti–mouse VEGF-A antibodies (50 μg per mouse), Tie-2/Fc plus goat anti–mouse VEGF-A antibodies (50 μg each per mouse), or human IgG Fc plus control goat IgG (50 μg each per mouse). There were 4 mice per group. Tumor size was estimated in square millimeters on day 14 after injection; the results are expressed as the mean percent tumor size (± SD) of tumors derived from inoculation of TEPC1165SZ plus BMMCs.

