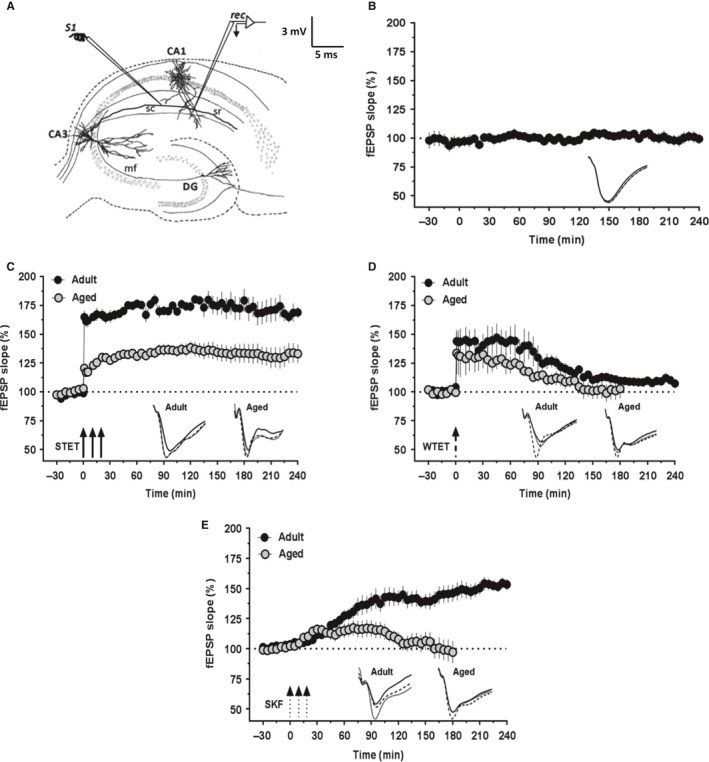
Figure 1.

High‐frequency stimulation (HFS)‐induced LTP and D1/D5 receptor agonist‐induced (DA‐LTP) potentiation in hippocampus are impaired in aged rats. (A) Schematic representation of a hippocampal slice showing the location of electrodes in CA1 region for field‐EPSP recording: stimulating electrode (S1) was positioned in stratum radiatum to stimulate Schaffer collaterals, and recording electrode (rec) was positioned onto CA1 apical dendrites. (B) Stable long‐term baseline recordings from the slices of aged rats (n = 10). The test stimulation was given every 5 min. The slope values did not show statistically significant deviation from the baseline values at any time point (Wilcoxon's test, P > 0.05). (C) L‐LTP induced by a strong tetanization protocol (STET; three arrows represent three HFS trains) in slices from 5‐ to 7‐week‐old rats (filled circles; n = 6) and 82‐ to 84‐week‐old rats (open circles; n = 9). The magnitude of potentiation was significantly less in the aged rat group compared with the adult rat group (Mann–Whitney U‐test, P < 0.05). (D) E‐LTP induced by a weak tetanization protocol (WTET; broken arrow represents the single weak stimulation train) in slices from adult rats (filled circles; n = 6) and aged rats (open circles; n = 7). The potentiation was slightly lesser in the slices of aged rats compared with that in adult group and decayed to baseline comparatively quickly, by 100 min (Wilcoxon's test, P > 0.05), whereas in adult slices it decayed to baseline after 150 min (Wilcoxon's test, P > 0.05). (E) Slow‐onset potentiation induced by bath application of the dopamine D1/D5 receptor agonist SKF‐38393 (SKF; three broken arrows represent the spaced stimulation) in slices from adult rats (filled circles; n = 8) and aged rats (open circles; n = 8). The potentiation was only transient in the slices of aged rats and decayed to the baseline quickly by 100 min, whereas it lasted over 4 h in the slices of aged rats. Error bars in all the graphs indicate ±SEM. Insets show representative fEPSP traces recorded at baseline (black solid line), 30 min (dotted line), and at the end of recording period (gray solid line). Scale bar for all the traces: 3 mV/5 ms.
