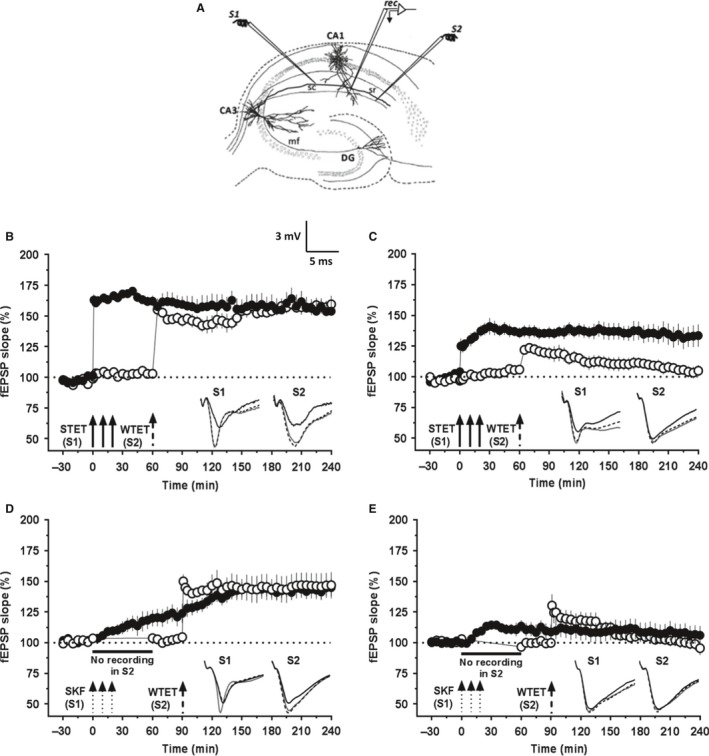
Figure 2.

Synaptic tagging and capture by HFS‐induced L‐LTP and DA‐LTP is impaired in hippocampal CA1 region of aged rats. (A) Schematic representation of a hippocampal slice depicting the location of electrodes in CA1 region for the synaptic tagging and capture (STC) experiments with two inputs. S1 and S2 are two stimulating electrodes positioned in the stratum radiatum to stimulate two independent synaptic inputs to the same neuronal population. The recording electrode is placed midway between S1 and S2 to record fEPSP from the apical dendrites. In (B) and (C), after a stable baseline recording of 30 min in S1 and S2, L‐LTP was induced in S1 by STET and 60 min later, WTET was applied to S2 for inducing E‐LTP in this pathway. In (D) and (E), the test stimulation in S2 was silenced just before SKF application for one hour. After resumption and 30 min of baseline recording, E‐LTP was induced in S2. (B) ‘Strong‐before‐weak (SBW)’ stimulation paradigm demonstrating STC in the adult rats (n = 6). STET in S1 (filled circles) resulted in a significant potentiation that remained till the end of recording (4 h, Wilcoxon's test, P = 0.027) and also led to the reinforcement of the WTET‐induced E‐LTP in S2 (open circles; 4 h, Wilcoxon's test, P = 0.027). (C) SBW paradigm in aged slices showed impaired STC (n = 8). The STET in S1 (filled circles) resulted in L‐LTP that remained over 4 h (Wilcoxon's test, P = 0.016) but did not lead to the reinforcement of the WTET‐induced E‐LTP in S2 (open circles). The potentiation in S2 was significant only until 145 min (Wilcoxon's test, P = 0.039) after which it gradually decayed to baseline (Wilcoxon's test, P > 0.05). (D) In the adult rat slices (n = 6), SKF induced a slow‐onset, persistent potentiation in S1 lasting 4 h (filled circles; Wilcoxon's test, P = 0.043) and also transformed the E‐LTP induced in S2 (open circles) into a persistent one (Wilcoxon's test, P = 0.043). (E) In the aged rat slices (n = 12), SKF induced a transient potentiation in S1 that decayed to baseline by 4 h (filled circles; Wilcoxon's test, P = 0.381) and failed to reinforce the E‐LTP induced in S2 (open circles, 4 h, Wilcoxon's test, P = 0.851). Insets show representative fEPSP traces for each input recorded at baseline (black solid line), 30 min after the respective tetanization/stimulation in each input (dotted line), and at 240 min (gray solid line). Symbols as in Fig. 1. Scale bar for the traces 3 mV per 5 ms.
