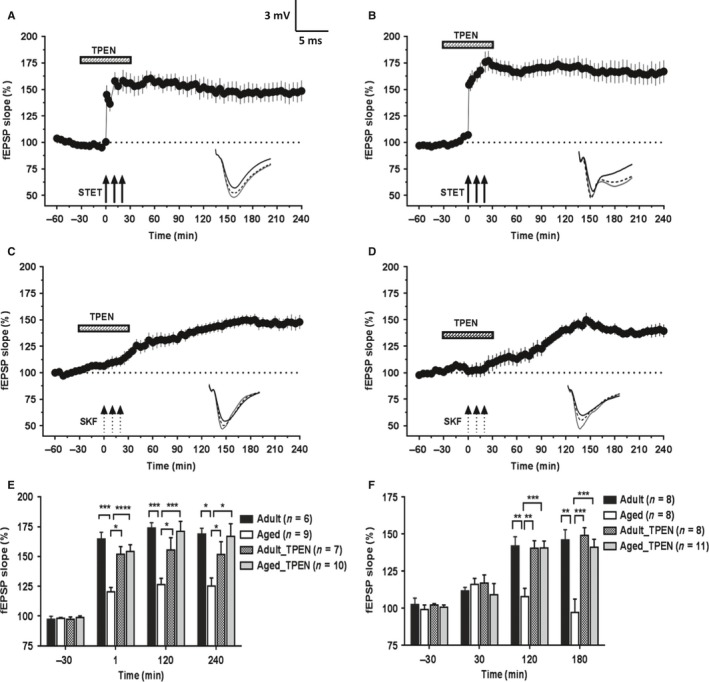
Figure 4.

Hippocampal Zn2+ chelation restores the deficits in HFS‐induced L‐LTP and DA‐LTP in aged rats. Following 30 min of stable baseline recording, a cell‐permeable Zn2+ chelator TPEN (5 μm) was bath‐applied to the slices for a total duration of 1 h. The time of TPEN application is shown with a horizontal bar in each graph. (A) STET‐induced L‐LTP in adult slices in the presence of TPEN (n = 7) was not significantly different from the control LTP (Mann–Whitney U‐test, P > 0.05). (B) In slices of aged rats, treatment with the Zn2+‐chelator TPEN resulted in substantial augmentation of STET‐induced LTP (n = 10). (C) Bath application of Zn2+‐chelator TPEN along with SKF to slices from adult rats did not affect the potentiation induced. The potentiation followed the same time course as of control DA‐LTP (4 h, Wilcoxon's test, P = 0.011, n = 8). (D) Application of SKF to aged slices in the presence of Zn2+‐chelator TPEN resulted in restoration of potentiation that lasted for 4 h (n = 8); potentiation at the end of 4 h was significantly different from the baseline values (Wilcoxon's test, P = 0.011). (E) A histogram comparing the mean potentiation at various time points (−30 min, +1 min, +120 min, and +240 min) between STET‐induced L‐LTP in adult and aged slices with or without TPEN treatment. (F) A histogram comparing the mean potentiation at various time points (−30 min, +30 min, +120 min, and +180 min) between SKF‐induced potentiation in adult and aged slices with or without TPEN treatment. Asterisks indicate significant difference between two groups (Mann–Whitney U‐test; *P < 0.05; **P < 0.01; ***P < 0.001). Error bars indicate ±SEM. Insets show representative fEPSP traces recorded at baseline (black solid line), 30 minutes after the respective tetanization/stimulation (dotted line), and at 240 min (gray solid line). Symbols as in Fig. 1. Scale bar for the traces 3 mV per 5 ms.
