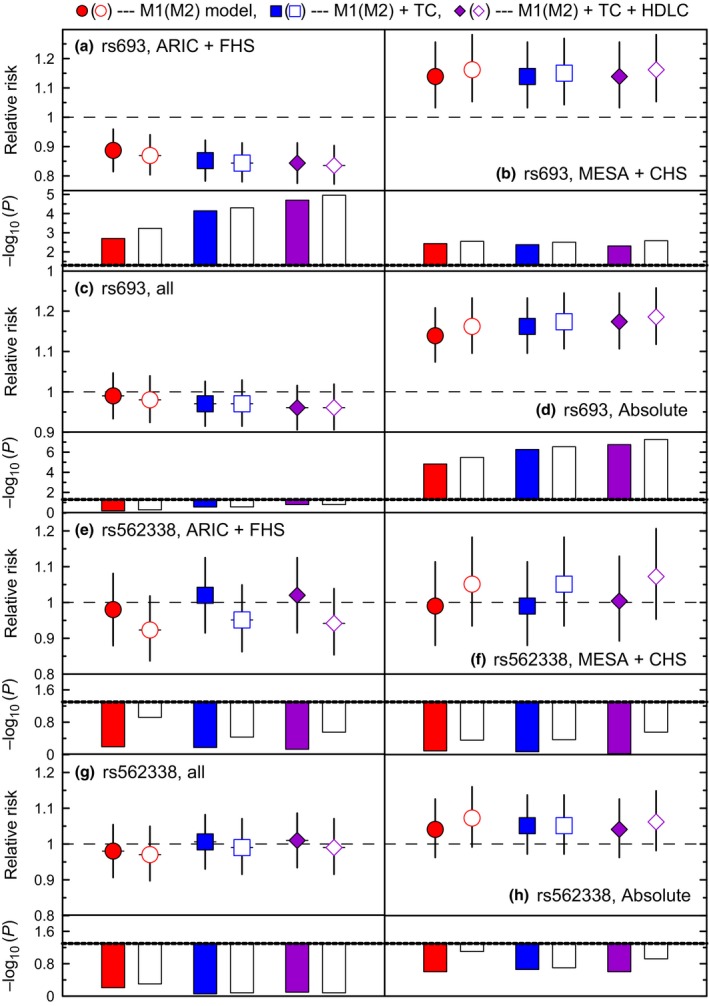
Figure 1.

Pooled associations of rs693 and rs562338 with the risks of MI. Symbols show relative risks (RRs) of MI for each SNP separately (M1, filled symbols) and SNPs additive effects (M2, open symbols). The analyses were not conditioned on lipids (dots) and conditioned on TC (squares), and TC and HDL‐C (diamonds). Vertical lines show 95% confidence intervals. Bars show −log10(P‐value). Dotted line shows cutoff for significance −log10(0.05) = 1.3. Figures show the results pooling (a, e) ARIC and FHS, (b, f) MESA and CHS, (c, g) all studies following GWAS, and (d, h) all studies disregarding the effect directions. Other details are in Table S8 (Supporting information).
