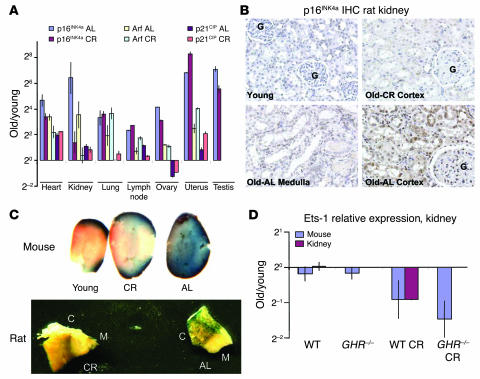
Figure 3.
Effects of caloric restriction and GHR deficiency on gene expression and aging. (A) Relative expression ratios (old/young, log2 scale) of cell cycle inhibitors in 7 tissues derived from old (28 months) and young (3 months) AL or CR F344 rats. The relative ratios are graphed ± SEM. Each estimate represents the mean of 8–16 quantitative RT-PCR reactions on independent RNA samples derived from 4 rats. (B) Immunoperoxidase staining on paraffin-embedded kidney sections from young, old AL, and old CR F344 rats using an anti-p16INK4a antibody. G, glomeruli seen in cortical sections. (C) SA-β-gal staining in AL and CR mouse and rat kidney. C, renal cortex; M, renal medulla. Thin tissue slices were stained for mice, as opposed to small tissue wedges for rats. SA-β-gal activity is predominantly restricted to the renal cortex. (D) Relative expression ratios (old/young, log2 scale) of Ets-1 in kidneys derived from AL and CR rats and mice. Results from the kidneys from AL and CR mice with and without GHR deficiency are also shown. Each estimate represents the mean of 8–32 quantitative RT-PCR reactions on independent RNA samples derived from 8 mice or 4 rats.

