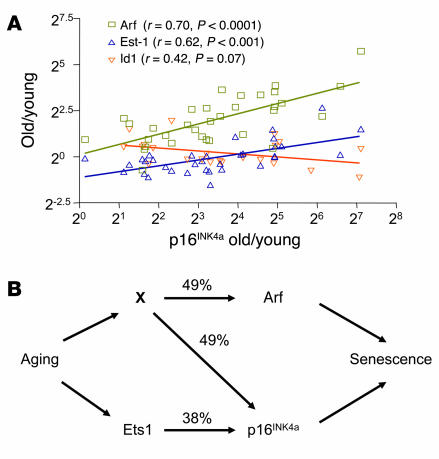
Figure 4.
p16INK4a expression with aging strongly correlates with Arf and Ets-1 expression. (A) A scatter plot (log2 scale, both axes) of the ratios (old/young) of p16INK4a expression versus the expression ratios (old/young) of Arf, Ets-1, and Id1 seen in the corresponding tissue (n = 22–70 data pairs per gene from up to 15 tissues in both mouse and rat). Each ratio represents a mean value of multiple measurements per tissue as described in Methods. A best-fit line determined by linear regression is shown for each data series, with Pearson correlation coefficient and 2-tailed P value. No significant correlation was seen between Arf and Ets-1, or between Arf or p16INK4a and Bmi-1 (not shown). (B) Arrows show known or inferred transcriptional relationships, and numbers indicate the covariances (r2) for the linked elements as determined in A. As p16INK4a and Arf do not regulate one another, it seems reasonable to assume that an unknown coregulator (X) modulates the expression of both transcripts with aging, explaining their strong correlation (r2 = 48%). Furthermore, as Arf and Ets-1 do not covary, X and Ets-1 must be independent. X need not represent a single transcription factor: it may represent the combined activity of several genes (e.g., the PcG family members) or genes that affect other transcript properties, such as message stability. This model suggests that the majority (87%) of the variance in p16INK4a expression with aging in the analyzed tissues can be attributed to the activity of X and Ets-1.

