Figure 3.

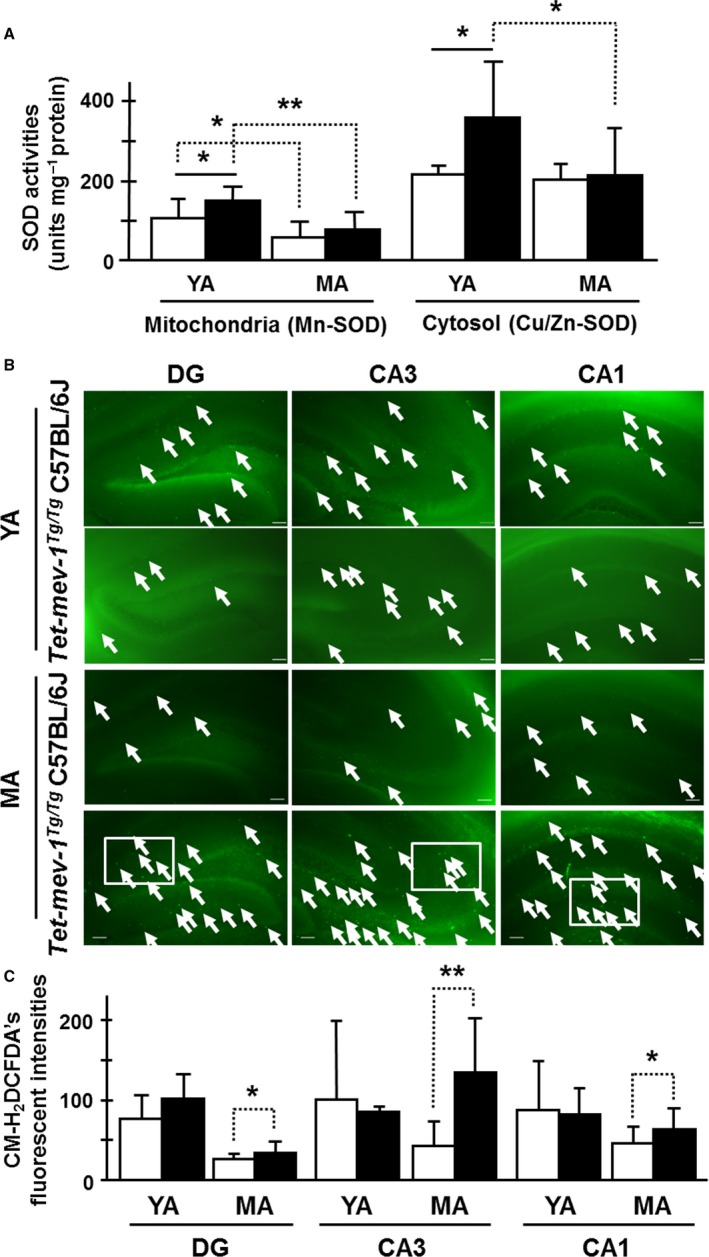
Superoxide dismutase (SOD) activities and intracellular ROS levels. (A) SOD activities in mitochondrial (Mn‐SOD) and cytosolic (Cu/Zn‐SOD) protein fractions of the hippocampal area. The white and black bars indicate the SOD activities (units per mg protein) in wild‐type C57BL/6J and Tet‐mev‐1 mice, respectively. Data are expressed as mean ± SD; *P < 0.05; **P < 0.01; n = 7 in each group. (B) Micrographs of intracellular ROS‐generated green fluorescence by CM‐H2DCFDA on in vitro‐cultured hippocampal tissue sections. White arrows indicate fluorescent‐positive astrocytes. Scale bar = 100 μm. White squares are described with higher magnification images in supplemental information, Fig. S5C. (C) The statistical bar charts of green fluorescent intensities on the dentate gyrus (DG), CA3, and CA1 regions of young adult (YA) and middle‐aged (MA) mice, respectively. The white and black bars indicate the CM‐H2DCFDA's fluorescent intensities in wild‐type C57BL/6J and Tet‐mev‐1 mice, respectively. Data are expressed as mean ± SD; *P < 0.05; **P < 0.01; n = 3 in each group.
