
Figure 1.
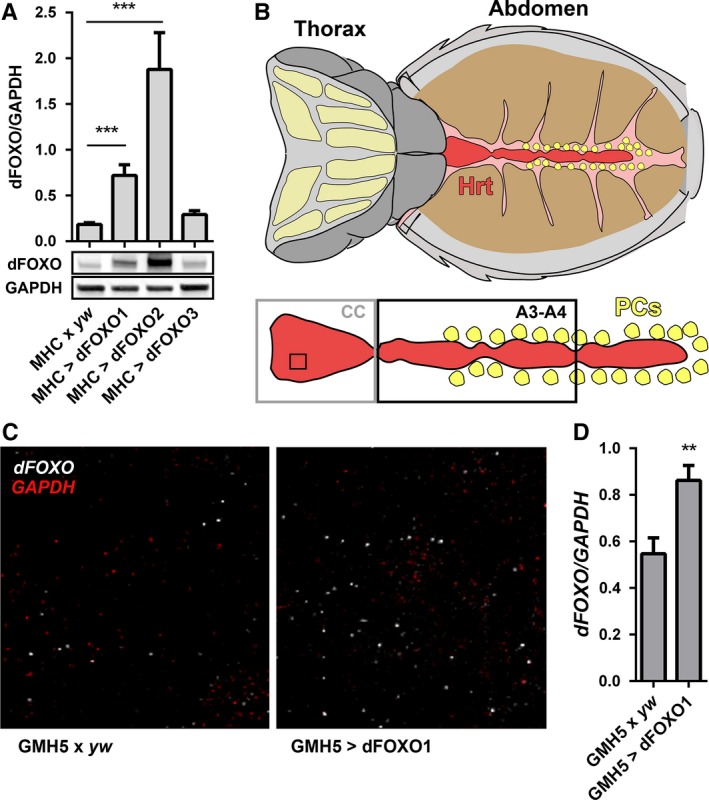
Overexpression of dFOXO in the Drosophila melanogaster heart. (A) dFOXO overexpression was assessed in skeletal muscle from three transgenic lines. Relative thoracic dFOXO content was determined via quantitative western blot analysis and compared to controls (MHC x yw) (n = 8, ***P < 0.001, one‐way ANOVA, Bonferroni post‐hoc test). (B) Illustration of the semi‐intact D. melanogaster dorsal vessel, or heart tube, preparation with the heart (Hrt) shown in red, the conical chamber (CC) boxed in gray, abdominal segments three and four (A3‐A4) boxed in black, and the pericardial cells (PCs) depicted in yellow (modified from Vogler & Ocorr, 2009). (C) Fluorescence in situ hybridization was used to visualize and quantify GMH5‐GAL4‐mediated dFOXO overexpression exclusively in the cardiomyocytes. The confocal images shown represent an area from the CC denoted by the black square in 1B. White particles are individual dFOXO messages and red particles individual GAPDH messages. The latter served as an endogenous control. (D) dFOXO and GAPDH transcripts were quantified from confocal micrographs using the ImageJ particle counter (see materials and methods). dFOXO/GAPDH in GMH5‐GAL4 > UAS‐dFOXO line 1 hearts was significantly higher than in control (GMH5‐GAL4 x yw) hearts (n = 20 hearts, **P < 0.01, Student's t‐test).