
Figure 4.
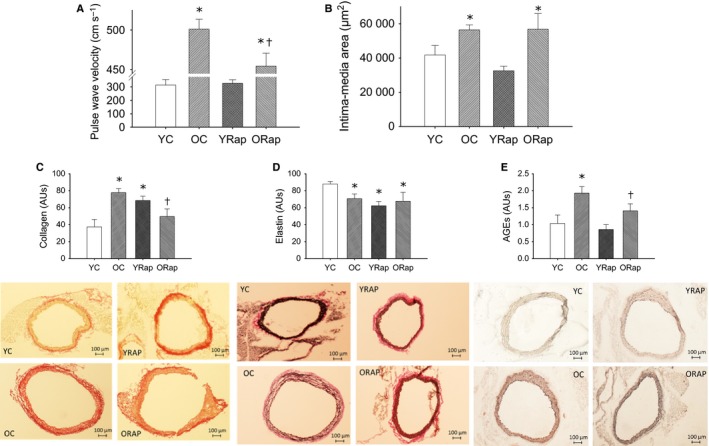
Large artery stiffness and arterial morphology and composition in young and old untreated and rapamycin‐treated mice. (A) Aortic stiffness, assessed by pulse‐wave velocity, in young (Y) and old (O) untreated and rapamycin (Rap)‐treated mice, (B) intima‐media area visualized by Maisson trichrome, (C) collagen expression measured by picrosirius red staining, (D) elastin expression measured by Verhoff Van Geisson staining, and (E) advanced glycation endproducts (AGEs) quantified by immunohistochemistry on histological sections of aortas from young and old untreated and rapamycin‐treated mice. Representative images are provided below the summary data. Differences were assessed by one‐way ANOVA with LSD post hoc.* denotes difference from untreated young, and † denotes difference from untreated old. Data are means ± SEM, P ≤ 0.05