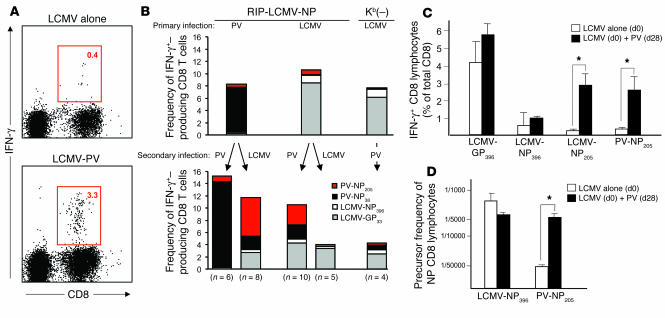
Figure 2.
CD8 T cell populations specific for the mimicking epitope PV-NP205 are significantly expanded after sequential infection with PV. (A and B) RIP-LCMV-NP and RIP-LCMV-NP × Kb(–) mice were infected with 105 PFU LCMV or PV. After 4 weeks, the mice received a secondary infection of either LCMV or PV. (A) Intracellular cytokine staining (ICCS) after stimulation with PV-NP205 is displayed for 1 representative mouse infected first with LCMV (LCMV alone) and then with PV (LCMV-PV) (mean frequencies are indicated in boxed areas). (B) The frequency of epitope-specific CD8 T cells in the blood was determined by ICCS for IFN-γ after stimulation with the indicated peptides (key) immediately before (upper panel) and 7 days after (lower panel) secondary infection. (C) Numbers of H-2Kb–restricted PV-NP205–specific lymphocytes after LCMV or PV infection, assessed by ICCS for IFN-γ. Splenocytes were harvested on day 35 from mice that received LCMV at day 0 (d0) and, for the PV group, PV at day 28 (d28). Means (± SEM) are displayed. (D) Lytic precursors after LCMV-NP396 versus PV-NP205 antigenic stimulation for 10 days. In addition to lytic activity, IFN-γ production was assessed in the supernatant of each well; wells with IFN-γ levels of more than 0.05 ng/ml by ELISA were counted as positive. IFN-γ production was on average 13 (± 3.5) ng/ml in LCMV-NP396–stimulated cultures and 7.1 (± 3.1) ng/ml in PV-NP205–stimulated cultures. This experiment was repeated three times and mean values (± SEM) are displayed. *P < 0.05.

