
Figure 8.
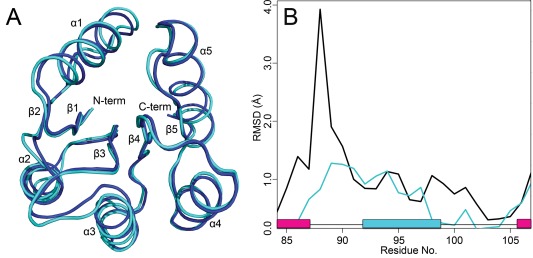
Global structural alignment of the top representative model to the BeF3 − bound crystal structure of CheY and comparisons of the β4‐α4‐β5 region. A: Final predicted model (light cyan). Crystal structure of CheY with bound (PDB 1FQW, dark blue). B: Per residue Cα RMSD for apo vs. crystals (black), and for predicted model versus crystal (cyan). The black trace shows the differences between the phosphorylated and unphosphorylated conformations. The cyan trace shows how closely the prediction matches the true crystal structure. α‐helix (cyan); β‐strand (magenta).