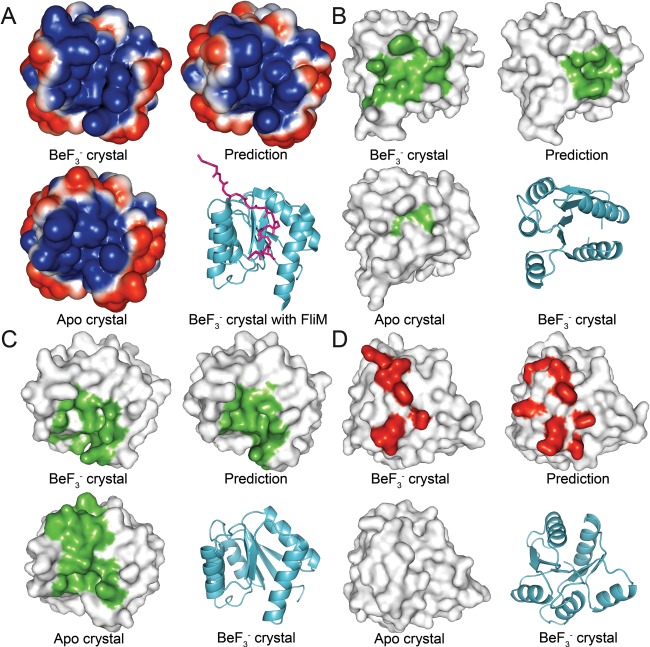
Figure 9.

Changes in physicochemical surface properties upon phosphorylation of CheY. Structures were aligned and partitioned into quadrants. View is of the same region on every structure. A: Electrostatic surface potential calculated for the CheY crystal structures and the representative model. Shown is the β4‐α4‐β5 face. A ribbon representation of the structure of CheY bound to FliM (PDB 1F4V) is shown for reference. Negative potential is blue; positive potential is red; FliM is magenta. B: Detected molecular cavity located near the active site of CheY. C: Detected molecular cavity located on the β4‐α4‐β5 surface. D: Detected molecular protrusion located near the active site of CheY.
