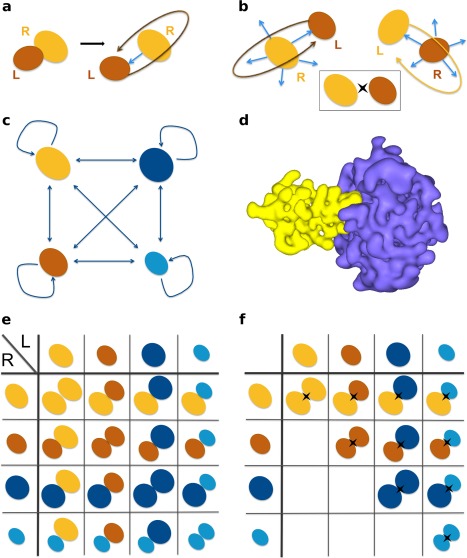
Figure 1.

Schematic representation of the docking protocols. (a) Biased docking starts from the original PDB file recording the coordinates of the known complex. The relative orientation of the ligand (in brown) compared to the receptor (in orange) is randomized prior to docking, but not its position. (b) Unbiased docking starts from five randomly chosen orientations and positions (blue arrows) of the ligand with respect to the receptor. For any pair of proteins, two docking calculations are performed (on top and at the bottom), so that each protein alternatively plays the role of the ligand and that of the receptor. The insert on the right gives a simplified representation of the two docking calculations for a pair of proteins. (c) In a complete cross‐docking experiment applied on an ensemble of four proteins, each protein (for example here, the orange one) is docked to all the other proteins, including itself. (d) Representation of molecular surfaces by HEX, with the order of the 3D expansion N = 25. The complex is that of trypsin (in purple) and its inhibitor (in yellow). (e) To identify partners using geometrical ranking, each line of the matrix is considered separately. (f) To identify partners using interface‐based ranking, the interaction index of a protein pair is determined over the two docking calculations involving the two proteins. The II matrix is symmetrical.
