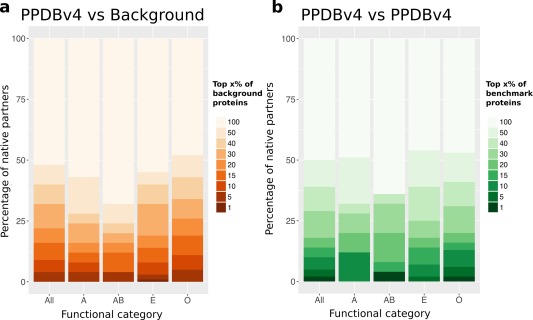
Figure 2.

Discrimination of cognate partners and non‐interactors based on geometrical ranking. (a) High‐throughput docking of PPDBv4 (352 proteins) against a background of 918 proteins. (b) Complete cross‐docking of PPDBv4. In y axis is reported the percentage of known interactors whose docking score distribution falls in the top x% of background distributions. The x% is indicated by the intensity of the color. For instance, the darkest orange rectangle in All, indicates that the known partners of 12 proteins from the benchmark set (12/372 = 3%, in y axis) are found in the top (x=) 1% of the background distributions (see color legend). In other words, 3% of the known interactors have a score distribution significantly better than 99% of the background distributions. The functional categories are the following: 26 antibodies‐antigens (A), 24 bound antibodies‐antigens (AB), 104 enzymes‐inhibitors (E), and 198 proteins with other functions (O).
